Run your architecture practice in Yantrio
Yantrio holds one living model of your enterprise and layers analysis, governance and delivery on top of it. This guide walks the whole platform in the order you would actually use it — following a single bank through a core banking migration, so every screen shows real work rather than an empty shell.
·What Yantrio is
Think of it as the replacement for juggling Visio, Excel and PowerPoint. Instead of diagrams that go stale the day they are drawn, you keep one model — and every view, report, risk register and programme plan reads from it.
Work flows through six stages, and the left sidebar is grouped to match them:
| Group | What you do there |
|---|---|
| Discover | Get the estate into the model — Inventory, Workspaces & canvas, Diagrams. |
| Plan | Decide what to do about it — Portfolio, Value chains, Matrices, Reports, Model health, Consistency. |
| Govern | Keep decisions honest — policies, risks, reviews, framework assessment. |
| Transform | Turn findings into delivery — programmes, AI Studio, blueprints, knowledge. |
| Organization | Who is involved — stakeholders, departments, integrations. |
| Dashboard | Pinned at the top: the state of the estate at a glance. |
Several modules group related screens behind a tab strip under the page title. Portfolio, for example, carries Overview, Gap analysis, Capabilities, Maturity and Compare. This guide follows that same structure, so what you read matches what you click.
·The worked example
Every screenshot in this guide comes from one workspace: Meridian Bank — core banking migration. Meridian is replacing a legacy mainframe core with Thought Machine Vault, running both in parallel before cutover.
It is deliberately small — 21 elements and 26 relationships — because a model you can read teaches more than one you cannot. It contains:
- Capabilities: Payments, Cards, Lending, Customer Onboarding, Fraud & Financial Crime, Regulatory Reporting.
- Processes: Open an account, Make a payment, Dispute a card transaction.
- Applications: Thought Machine Vault (new core), Mainframe core (legacy), Payment hub (ISO 20022), Fraud scoring, Internet banking, Mobile banking app, Branch teller, Card management.
- Data & platform: Customer master, Product catalogue, Data lakehouse, Azure landing zone.
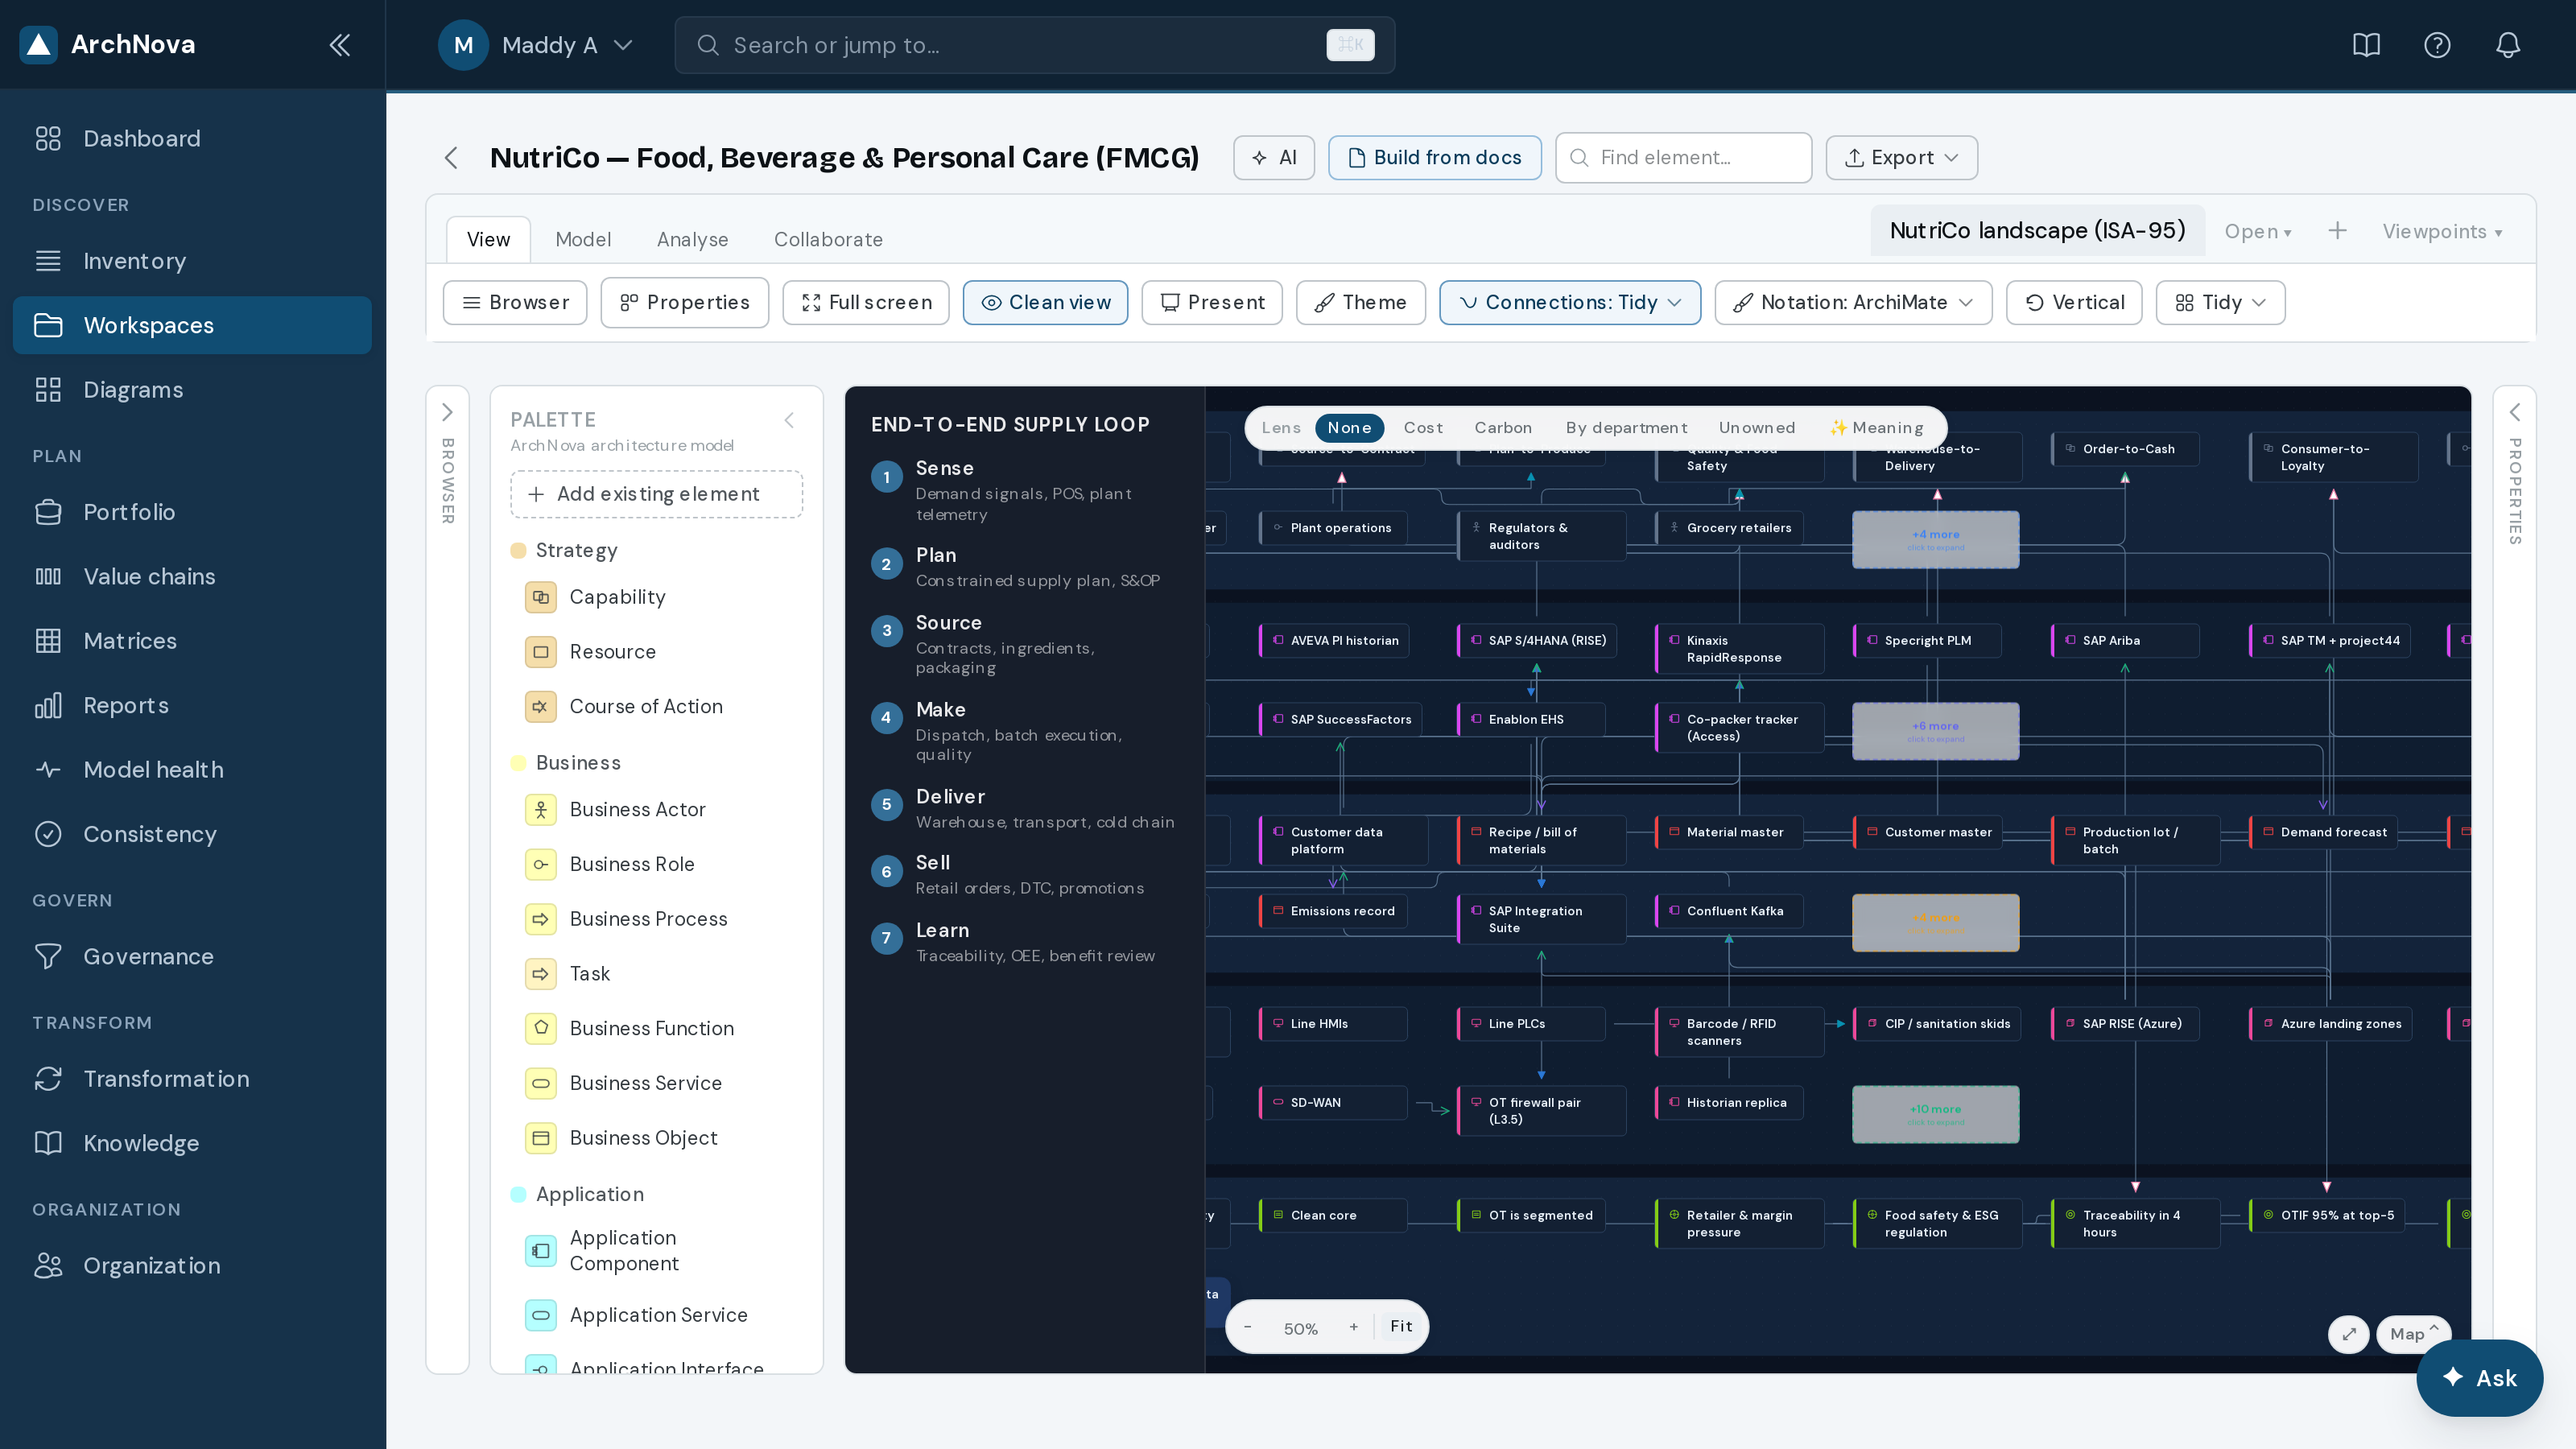
Where a screen needs a larger estate to make its point — scale, or a programme in flight — the guide switches to NutriCo, a consumer-goods model, and says so in the caption.
Signing in and finding your way
1Sign in
Open the app URL and sign in with your email and password, or with a Google, Microsoft or SSO account if your organisation uses one.
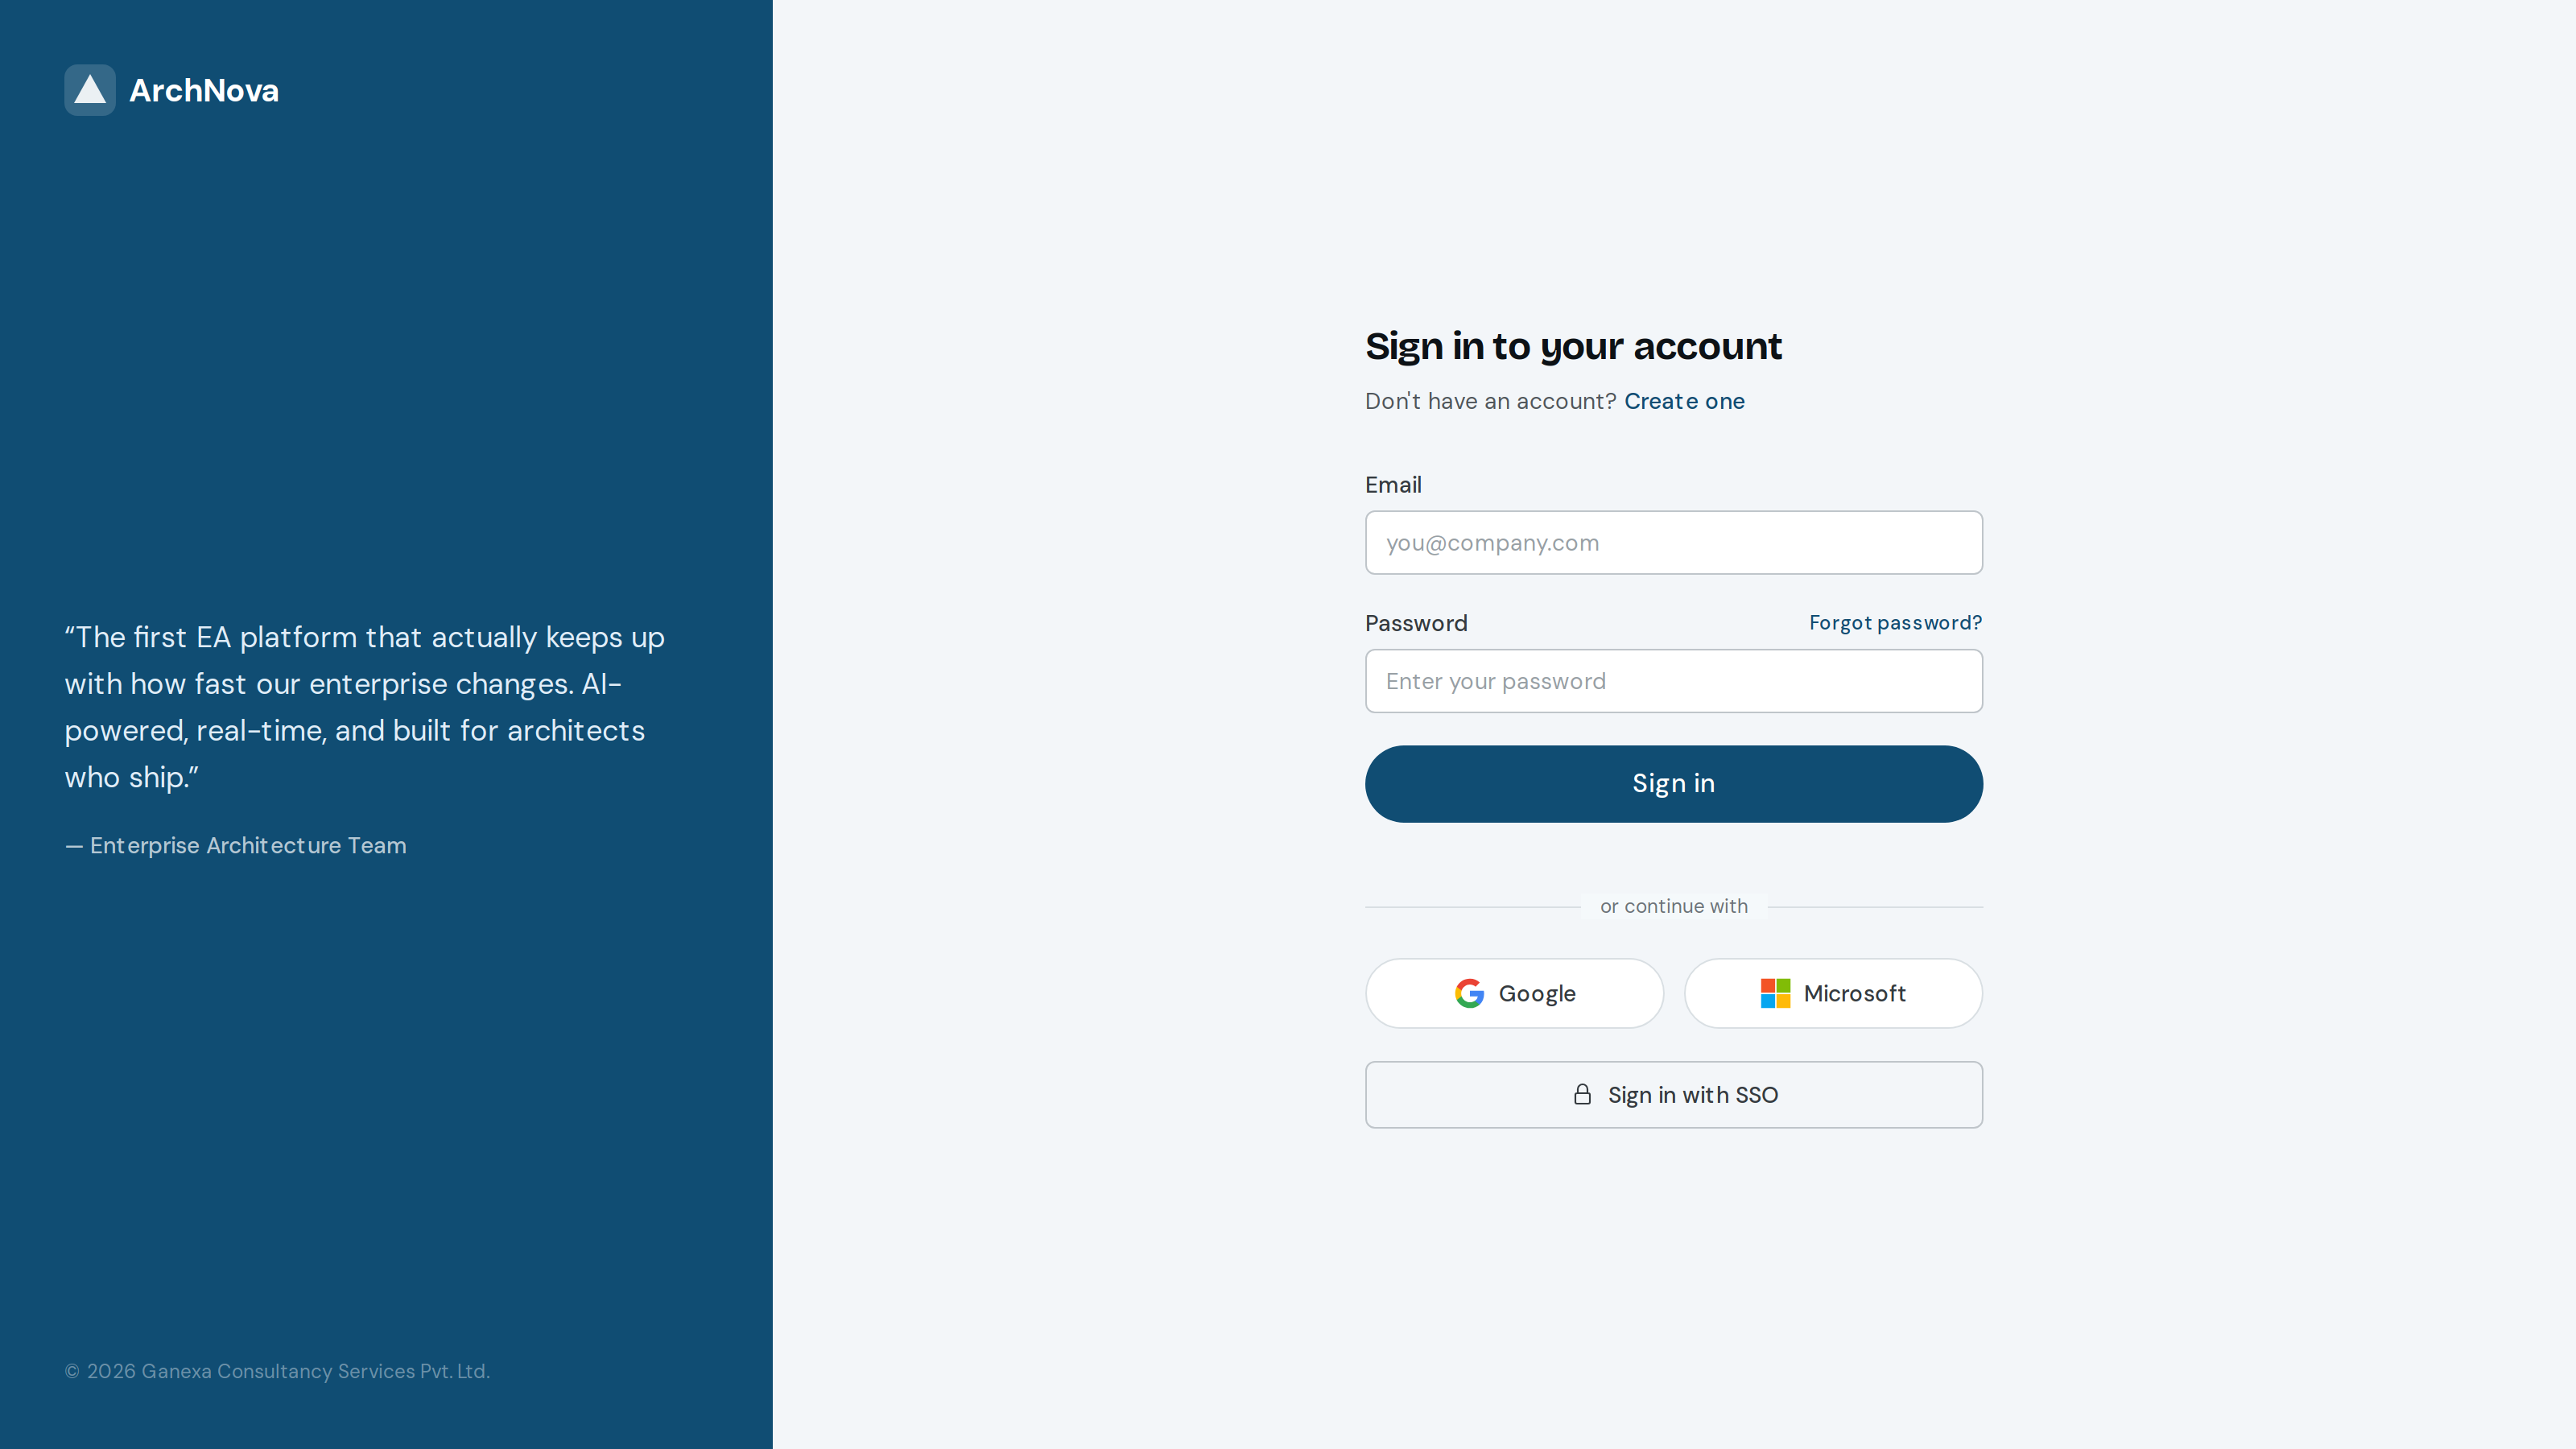
- Enter your email and password, then select Sign in.
- New here? Choose Create one, then confirm your address from the verification email before signing in.
- If your organisation uses single sign-on, use Sign in with SSO and enter your work email — you will be redirected to your own identity provider.
2How the app is laid out
The Home launcher gives you a tile per module and a summary of what changed. It is the fastest way to orient yourself at the start of a session.
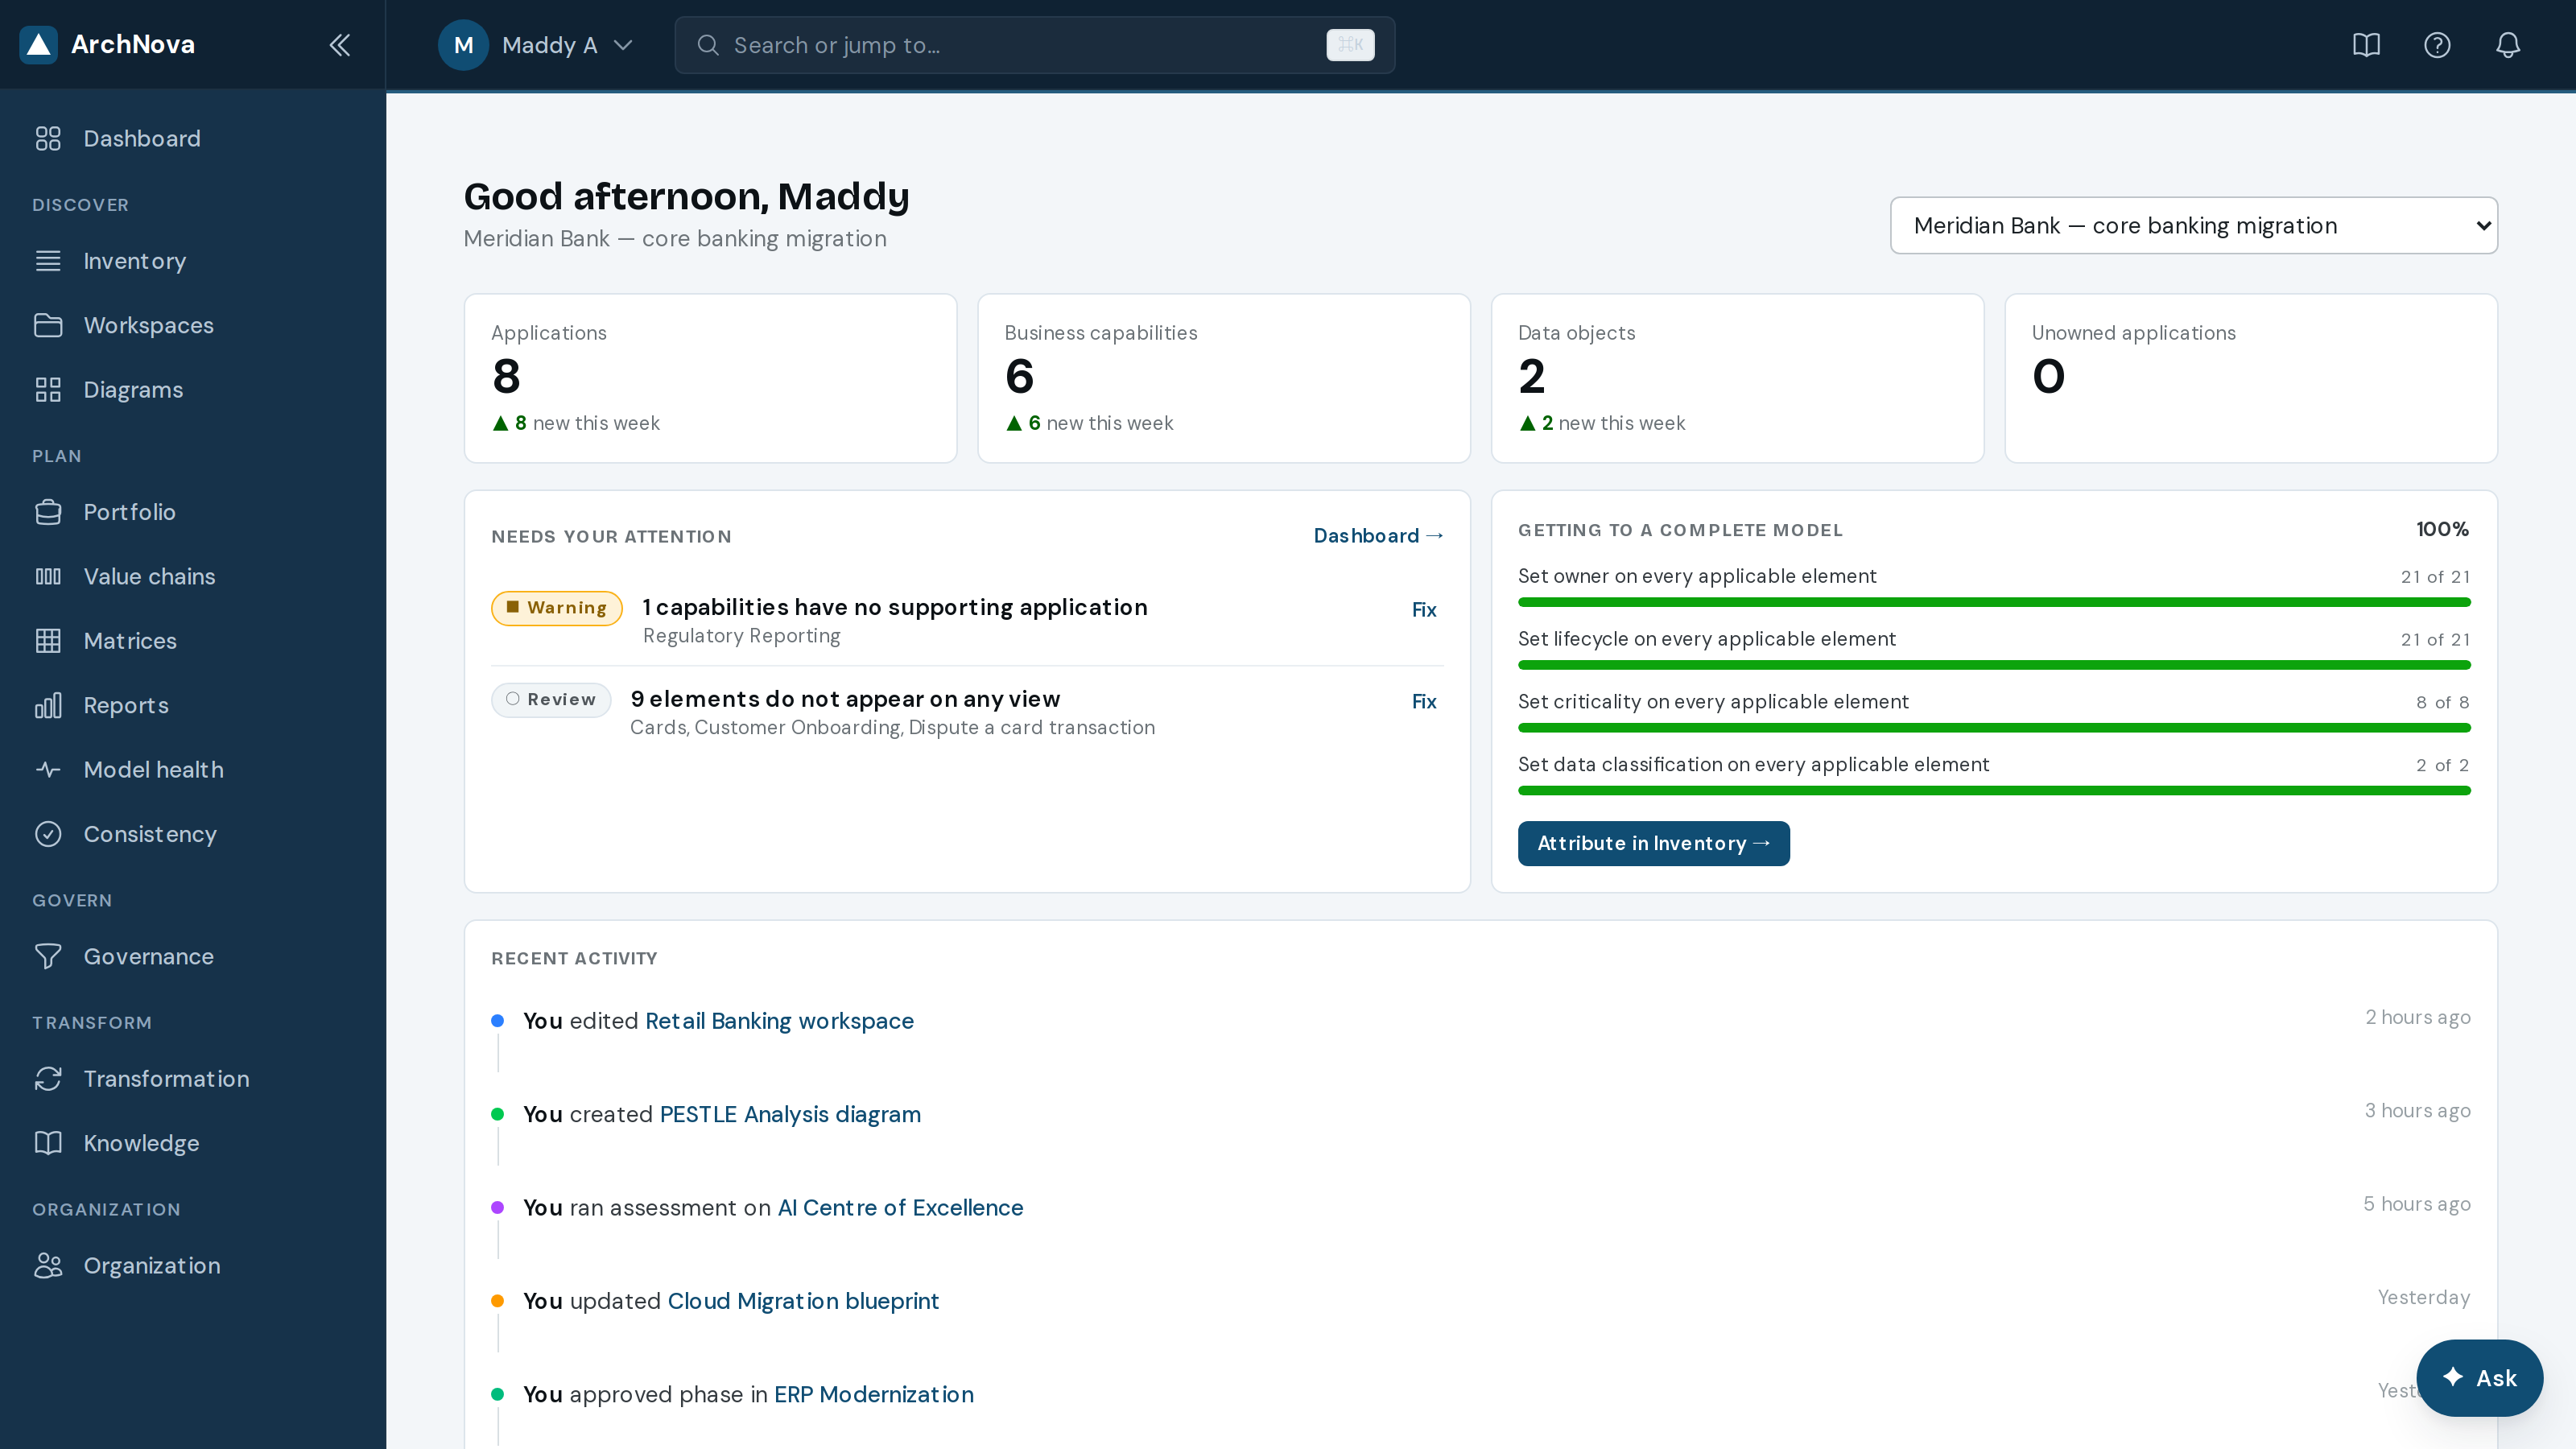
Three things are always available, wherever you are:
- The sidebar on the left, grouped into the six stages. Collapse it with the chevron at the top when you need width.
- The search bar at the top. Press ⌘K (or CtrlK) anywhere to jump to a module, find an element, or run an action.
- The Ask button, bottom right — the assistant, scoped to whatever you are looking at.
3Dashboard
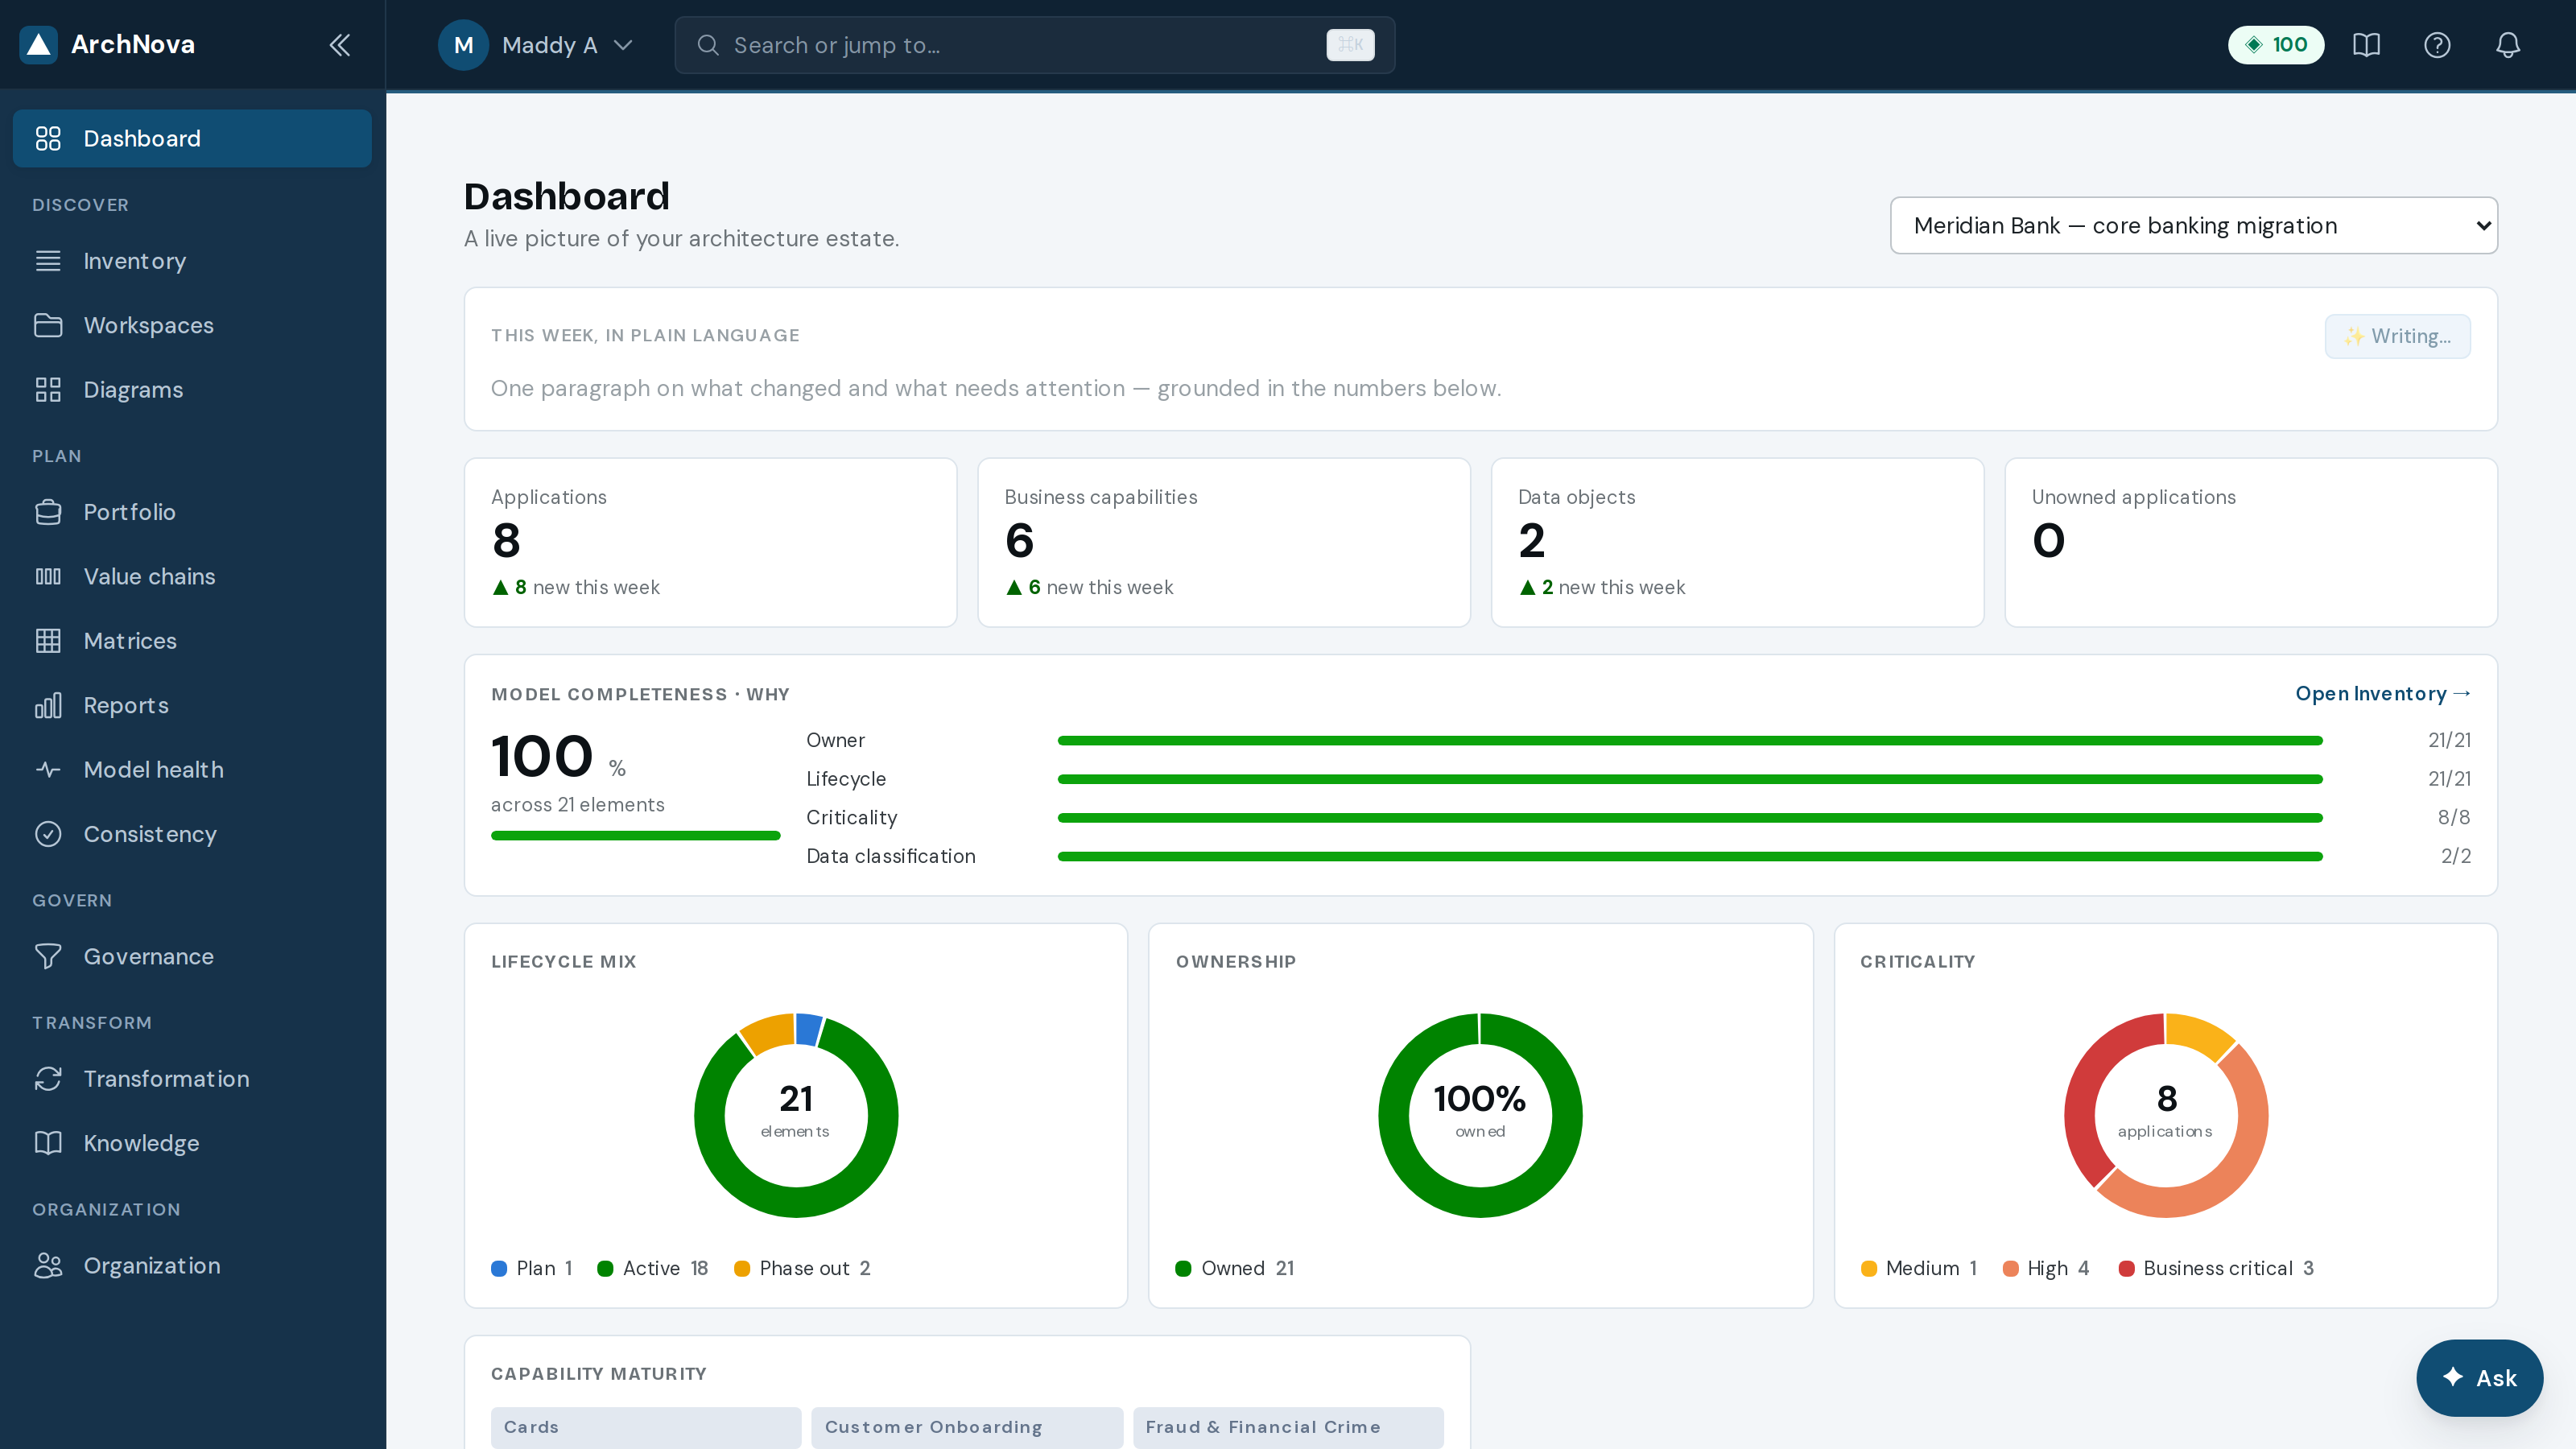
The Dashboard answers “what state is the estate in?” for one workspace at a time. Pick the workspace from the selector at the top right.
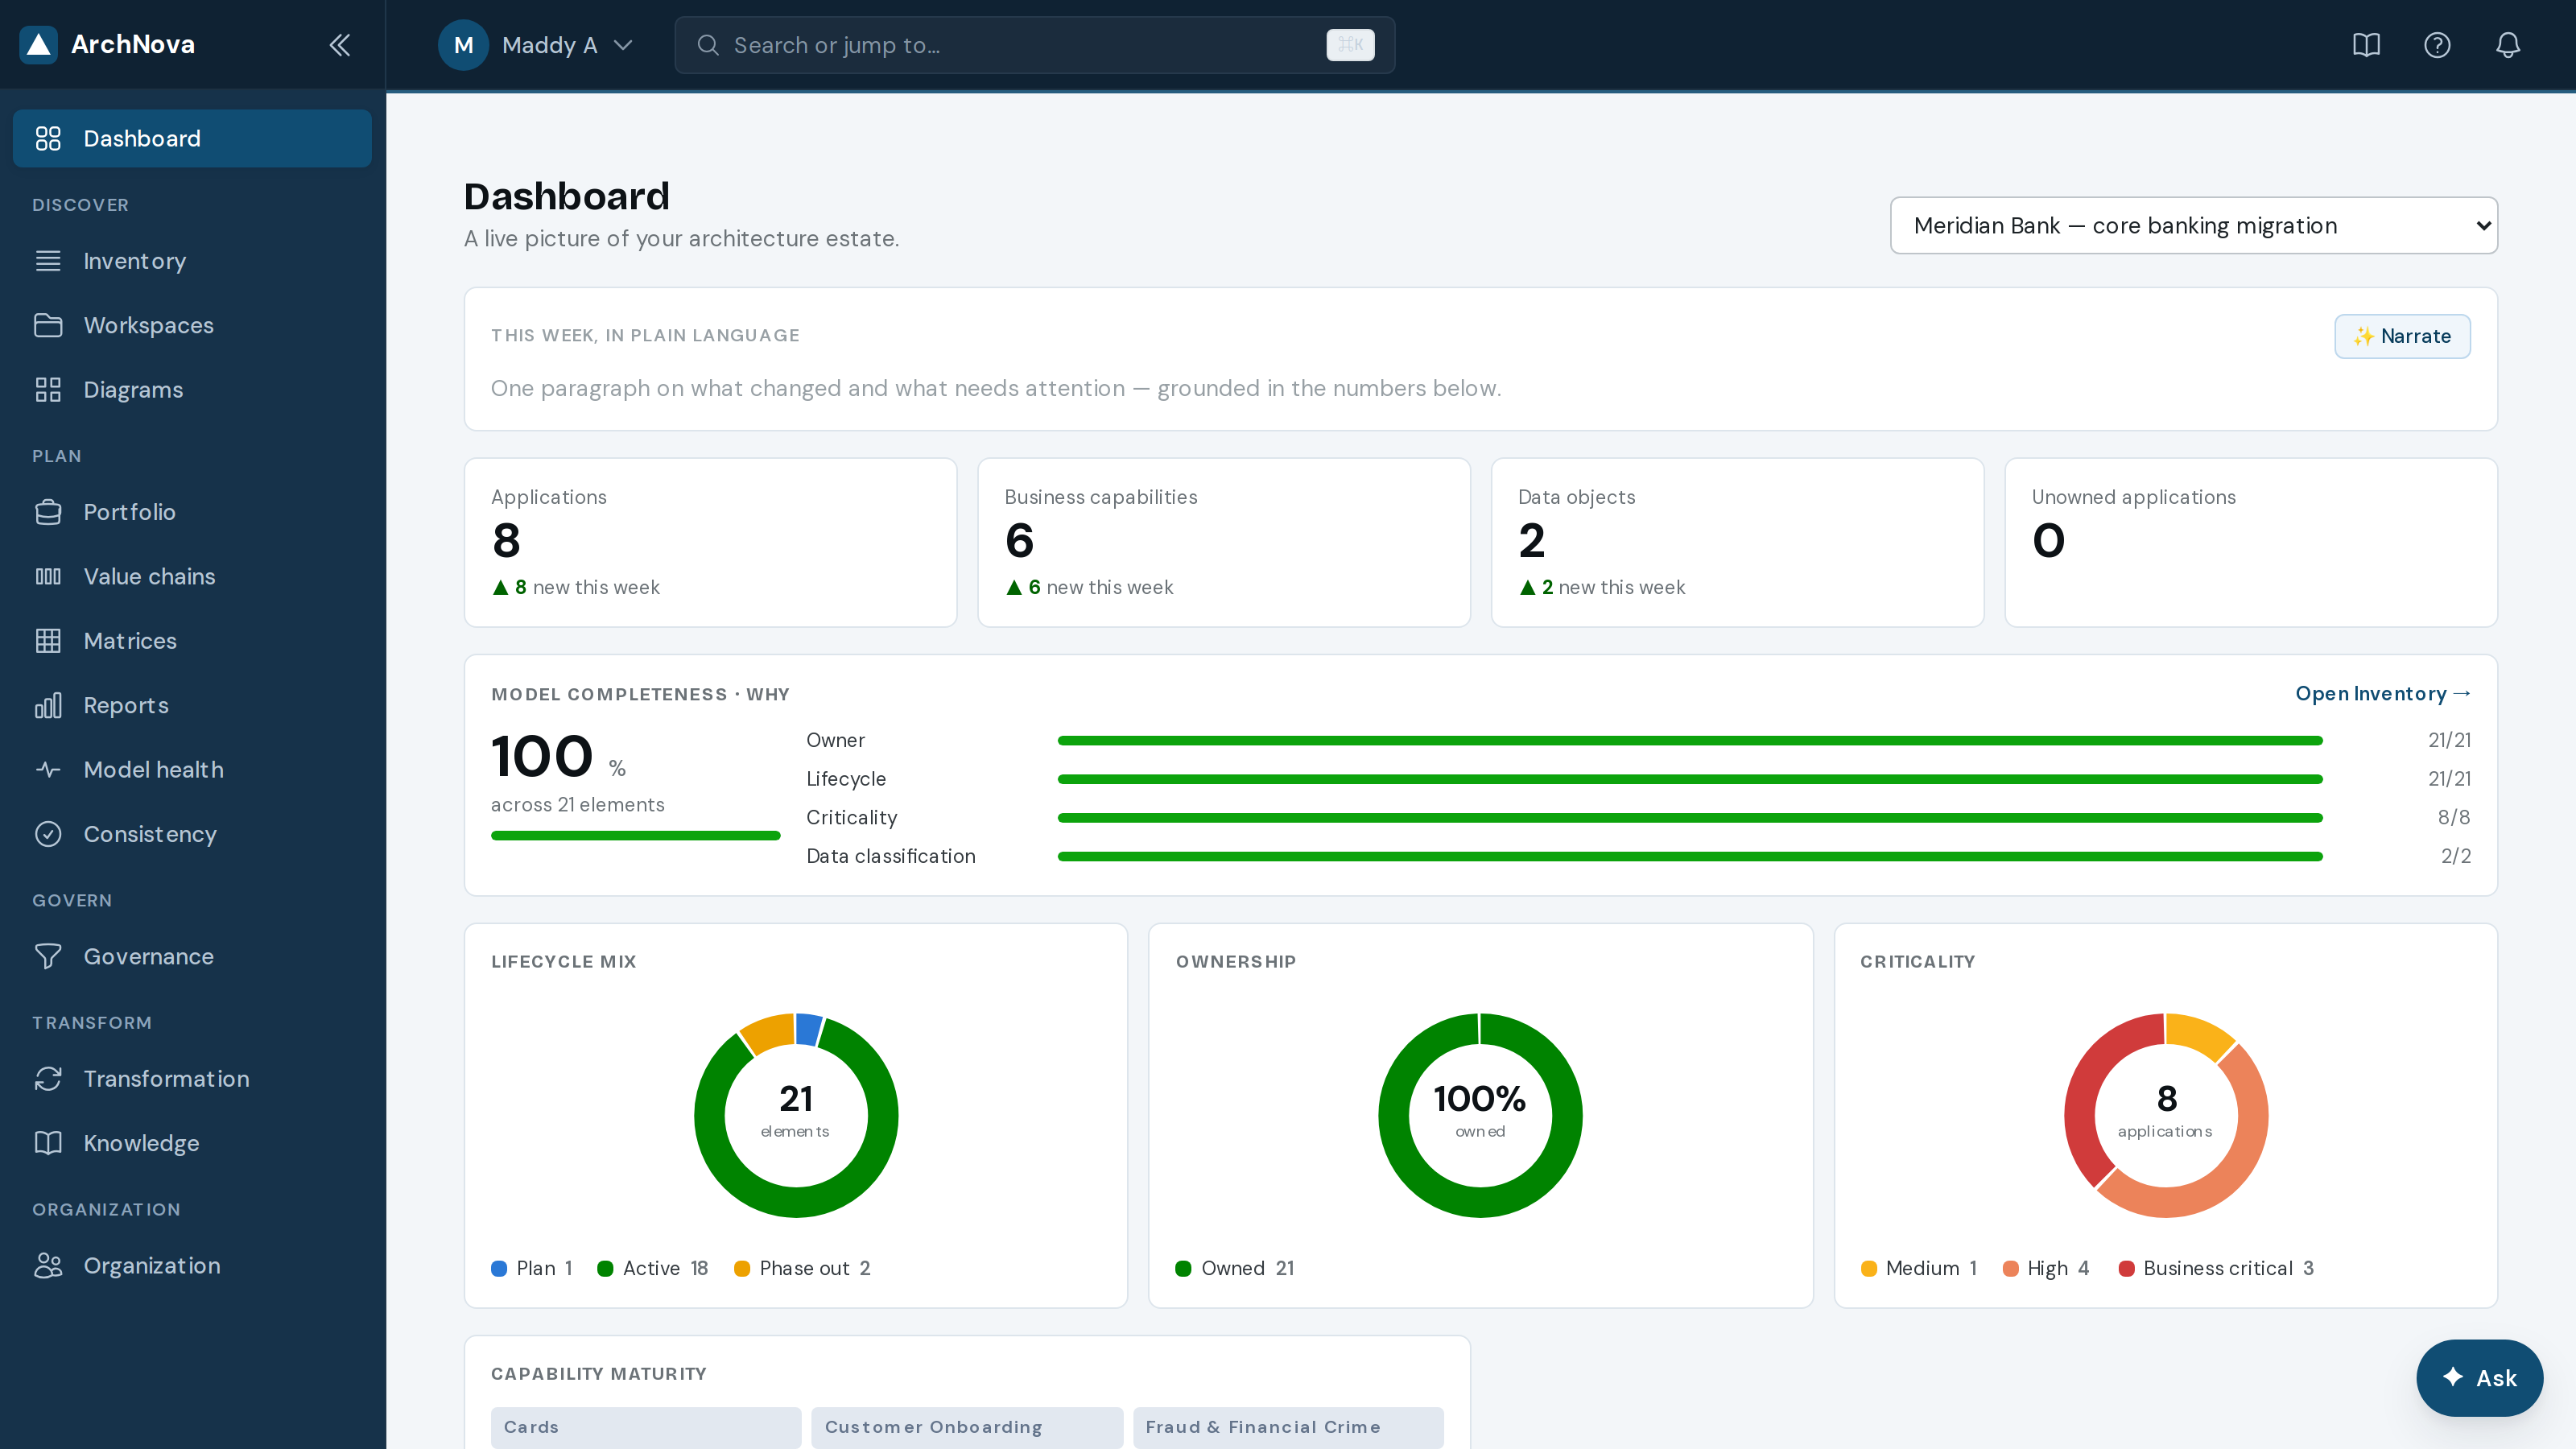
- The top row counts applications, capabilities, data objects and integrations — the shape of the estate in four numbers.
- Model completeness shows how much of the required attribute set is filled. Click through to fix the gaps in Inventory.
- The donuts break down lifecycle, criticality and ownership. An estate with a large “Not set” slice is not ready to make decisions from.
- Needs attention is a deterministic queue — orphaned capabilities, missing owners, elements past end-of-life — not a guess.
Getting the estate into the model
You cannot rationalise what you have not written down. Discover is where the model gets built — by hand, from a spreadsheet, or from your existing documents.
4Inventory
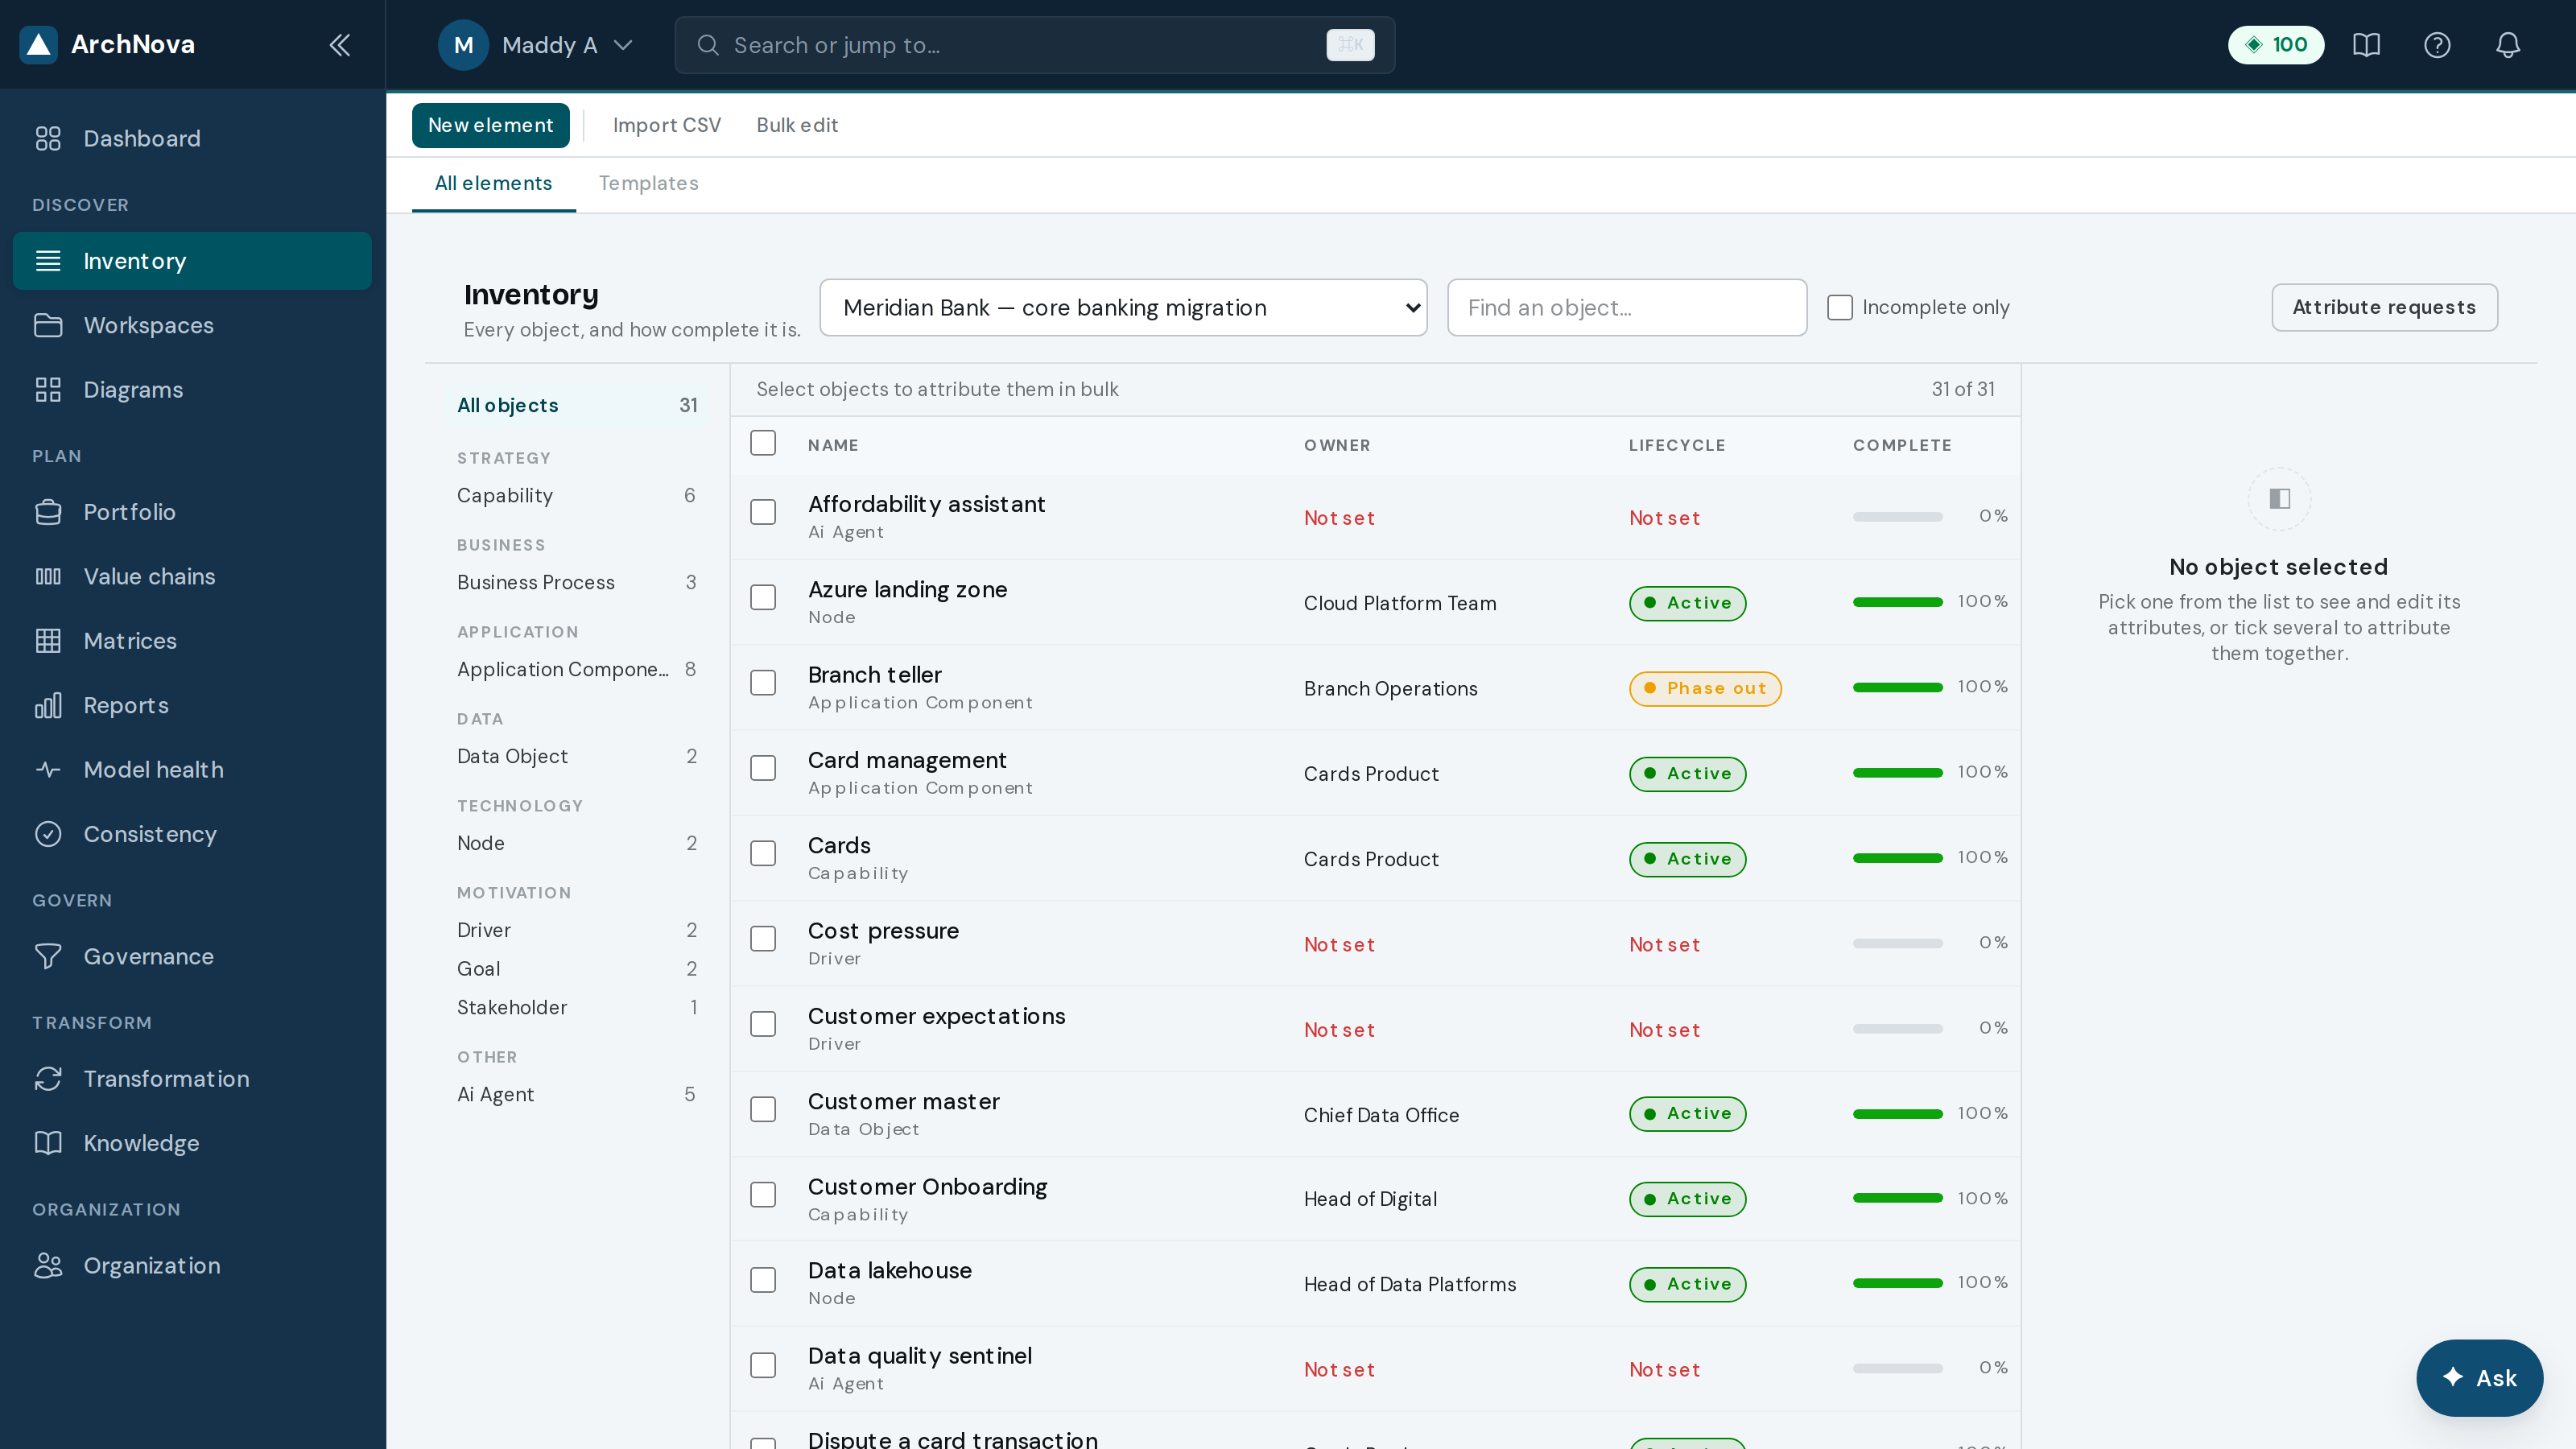
Inventory is the spreadsheet view of your model: every element, every attribute, in one sortable table. It is the fastest way to fill gaps in bulk.
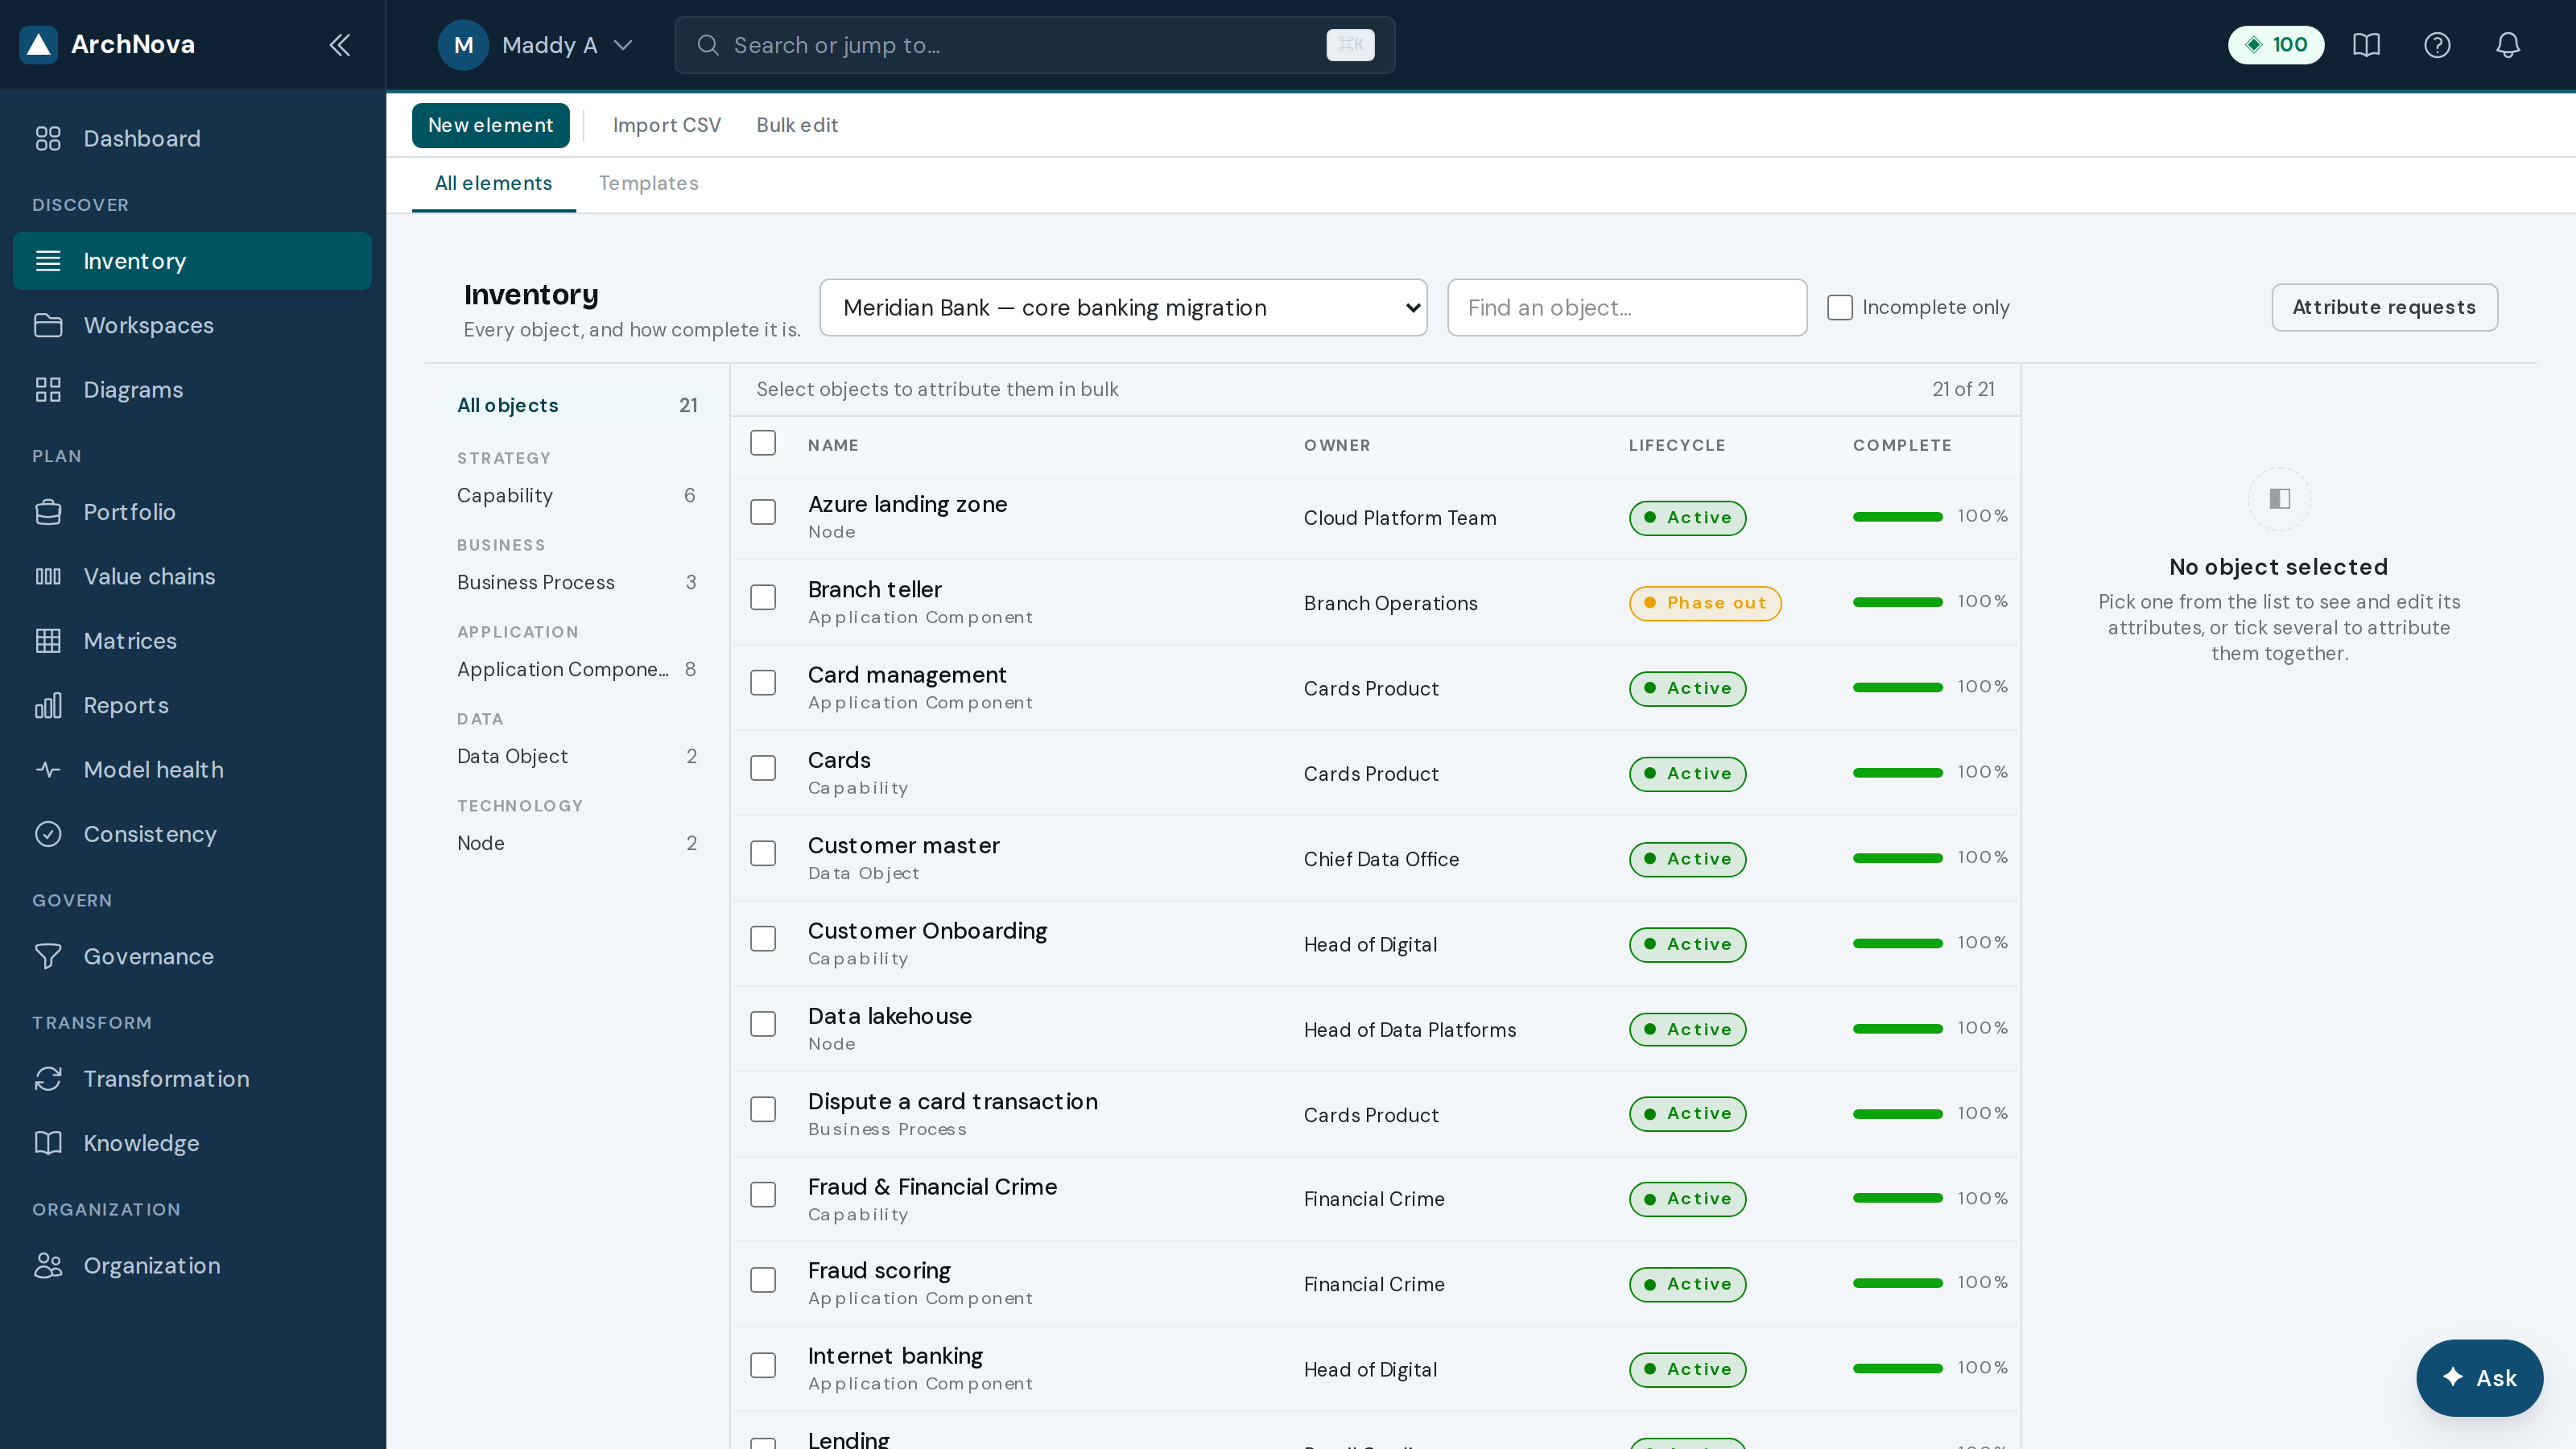
- Filter by workspace, type and free text to narrow to the set you are working on.
- Select rows with the checkboxes, then use Bulk edit to set an owner, lifecycle or department across many elements at once.
- Import CSV brings an existing spreadsheet in; column mapping happens on the way.
- The Templates tab holds starting scaffolds and industry packs — see Templates & packs.
5Workspaces
A workspace is one model — typically one organisation, business unit or programme. Meridian’s migration is a workspace; so is each published demo.
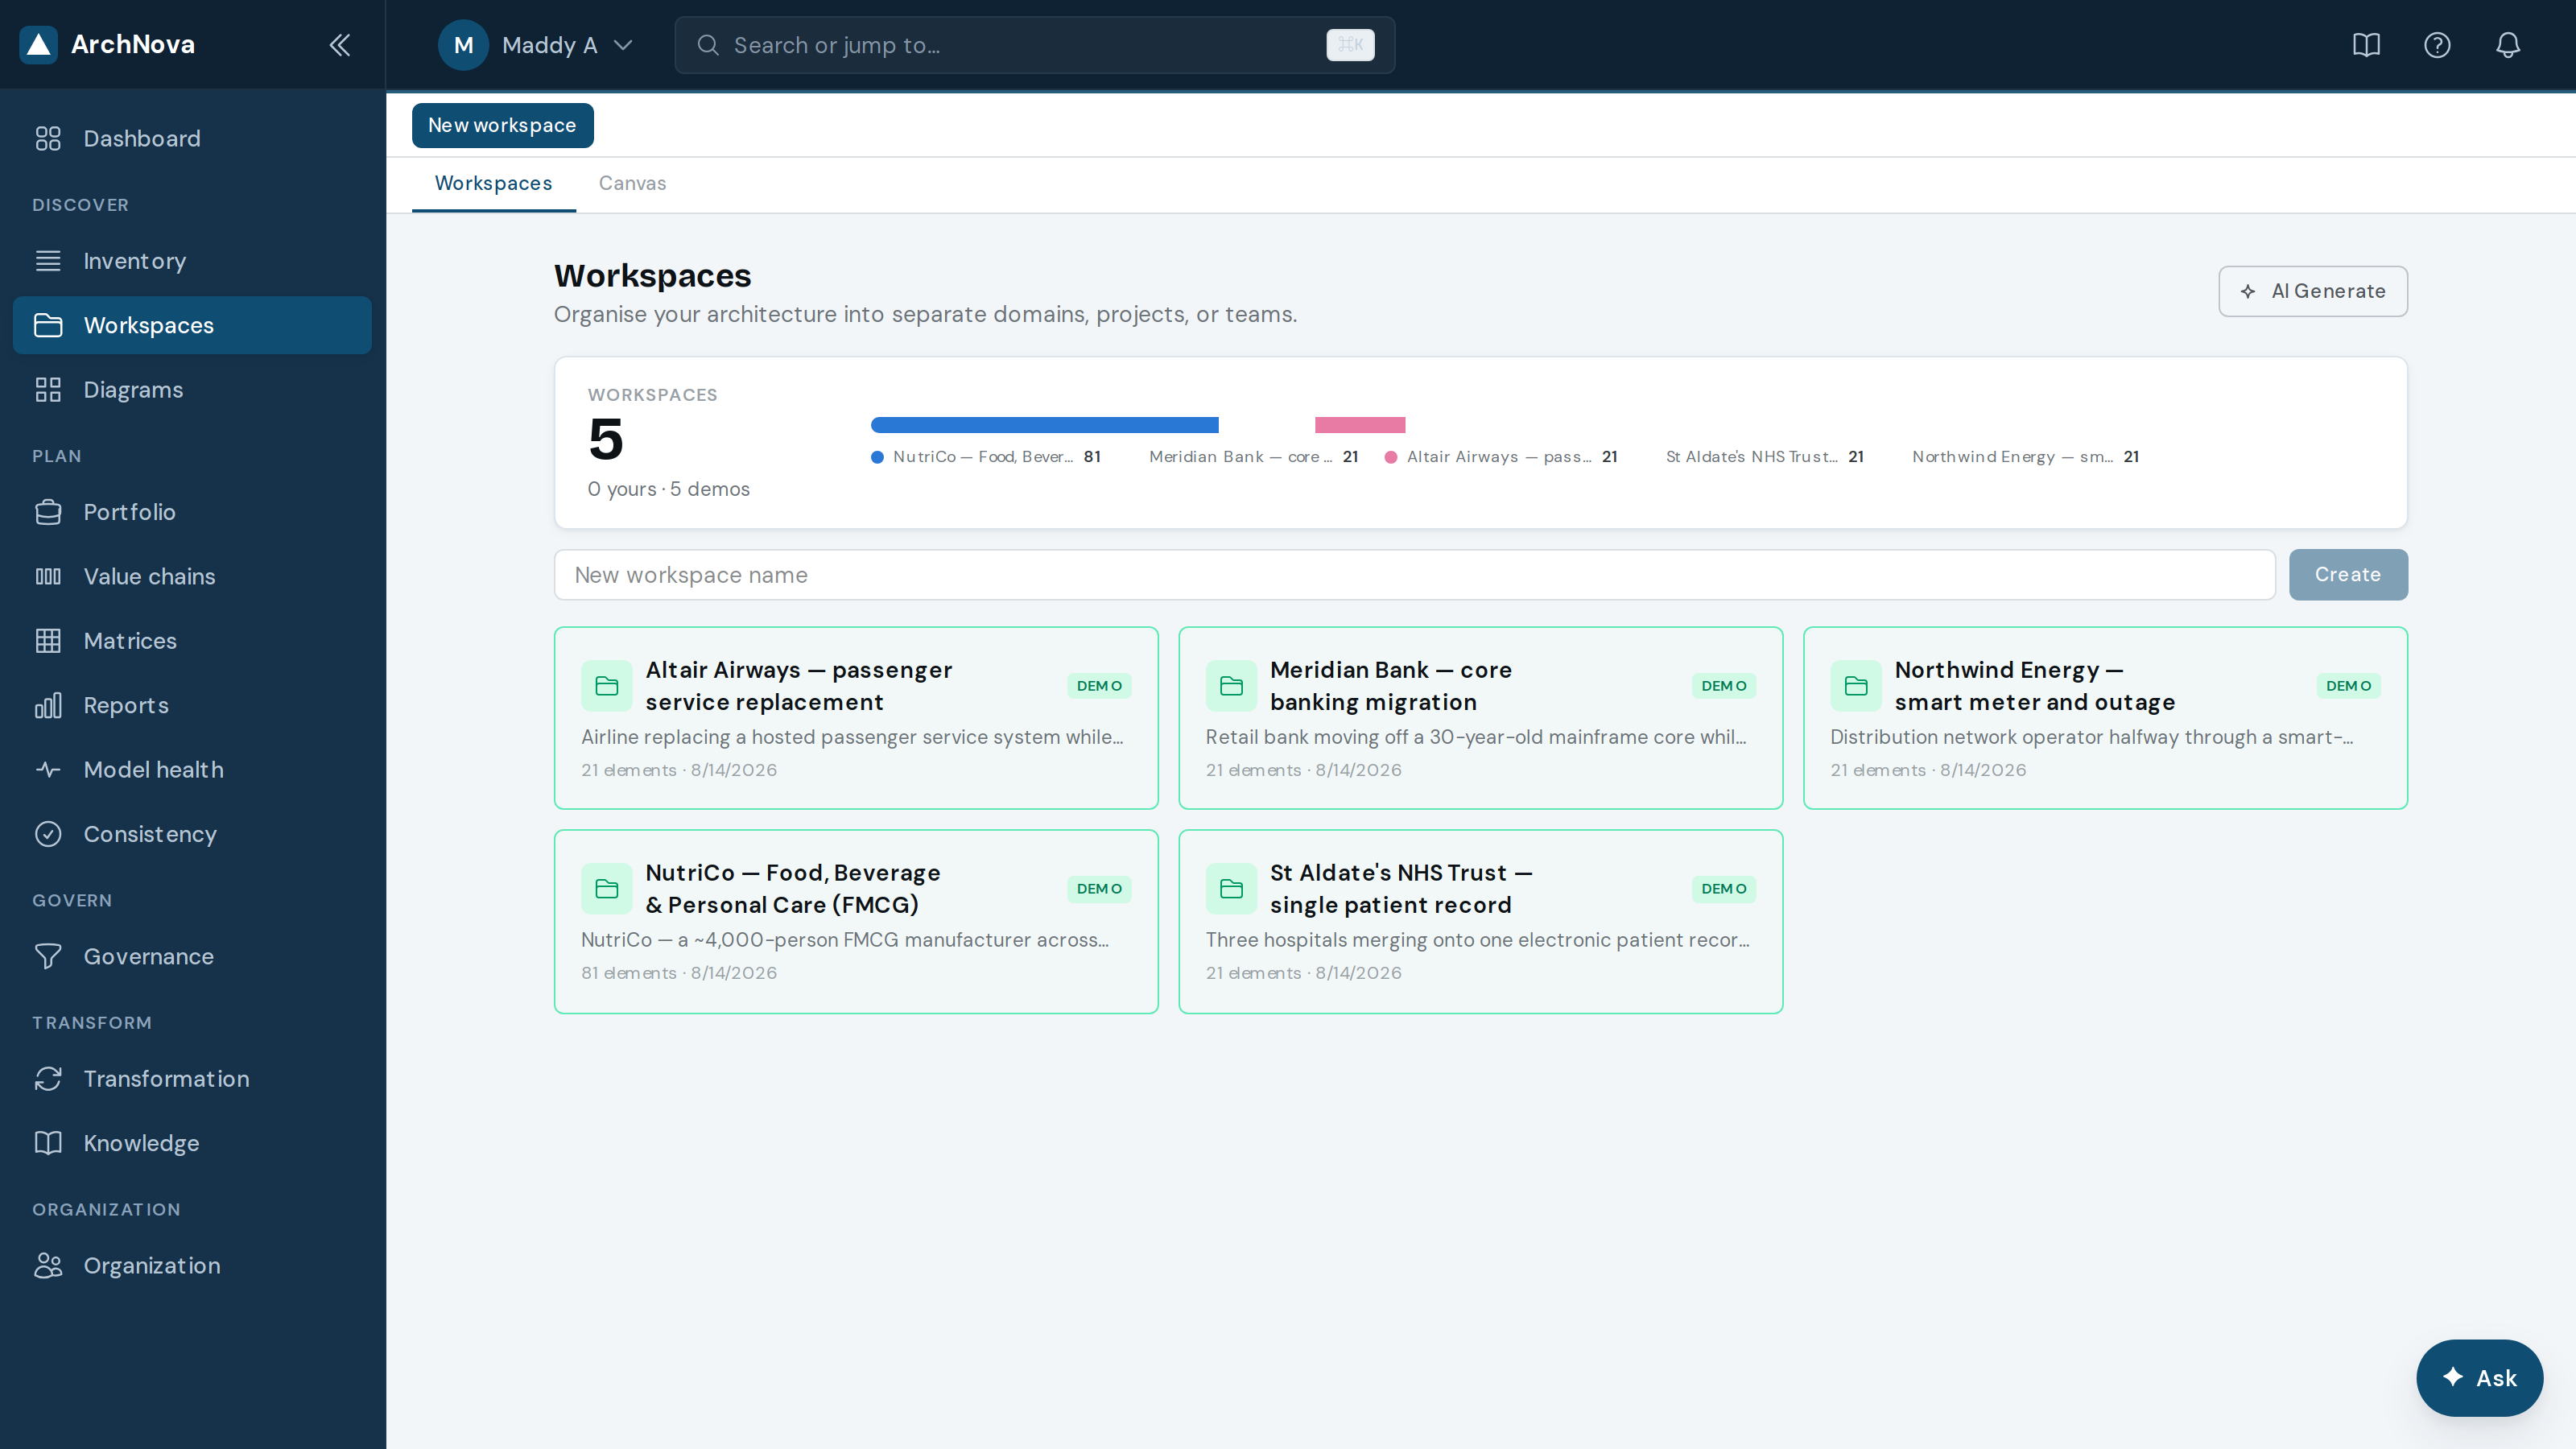
- New workspace creates an empty model, or starts one from a template or industry pack.
- Open a workspace to go straight to its canvas.
- Use the card menu to duplicate a model — useful for “what if we did it this way instead”, which Compare can then diff.
- Showcase holds published read-only demos. Make a copy drops one into your own account to experiment with.
6The canvas
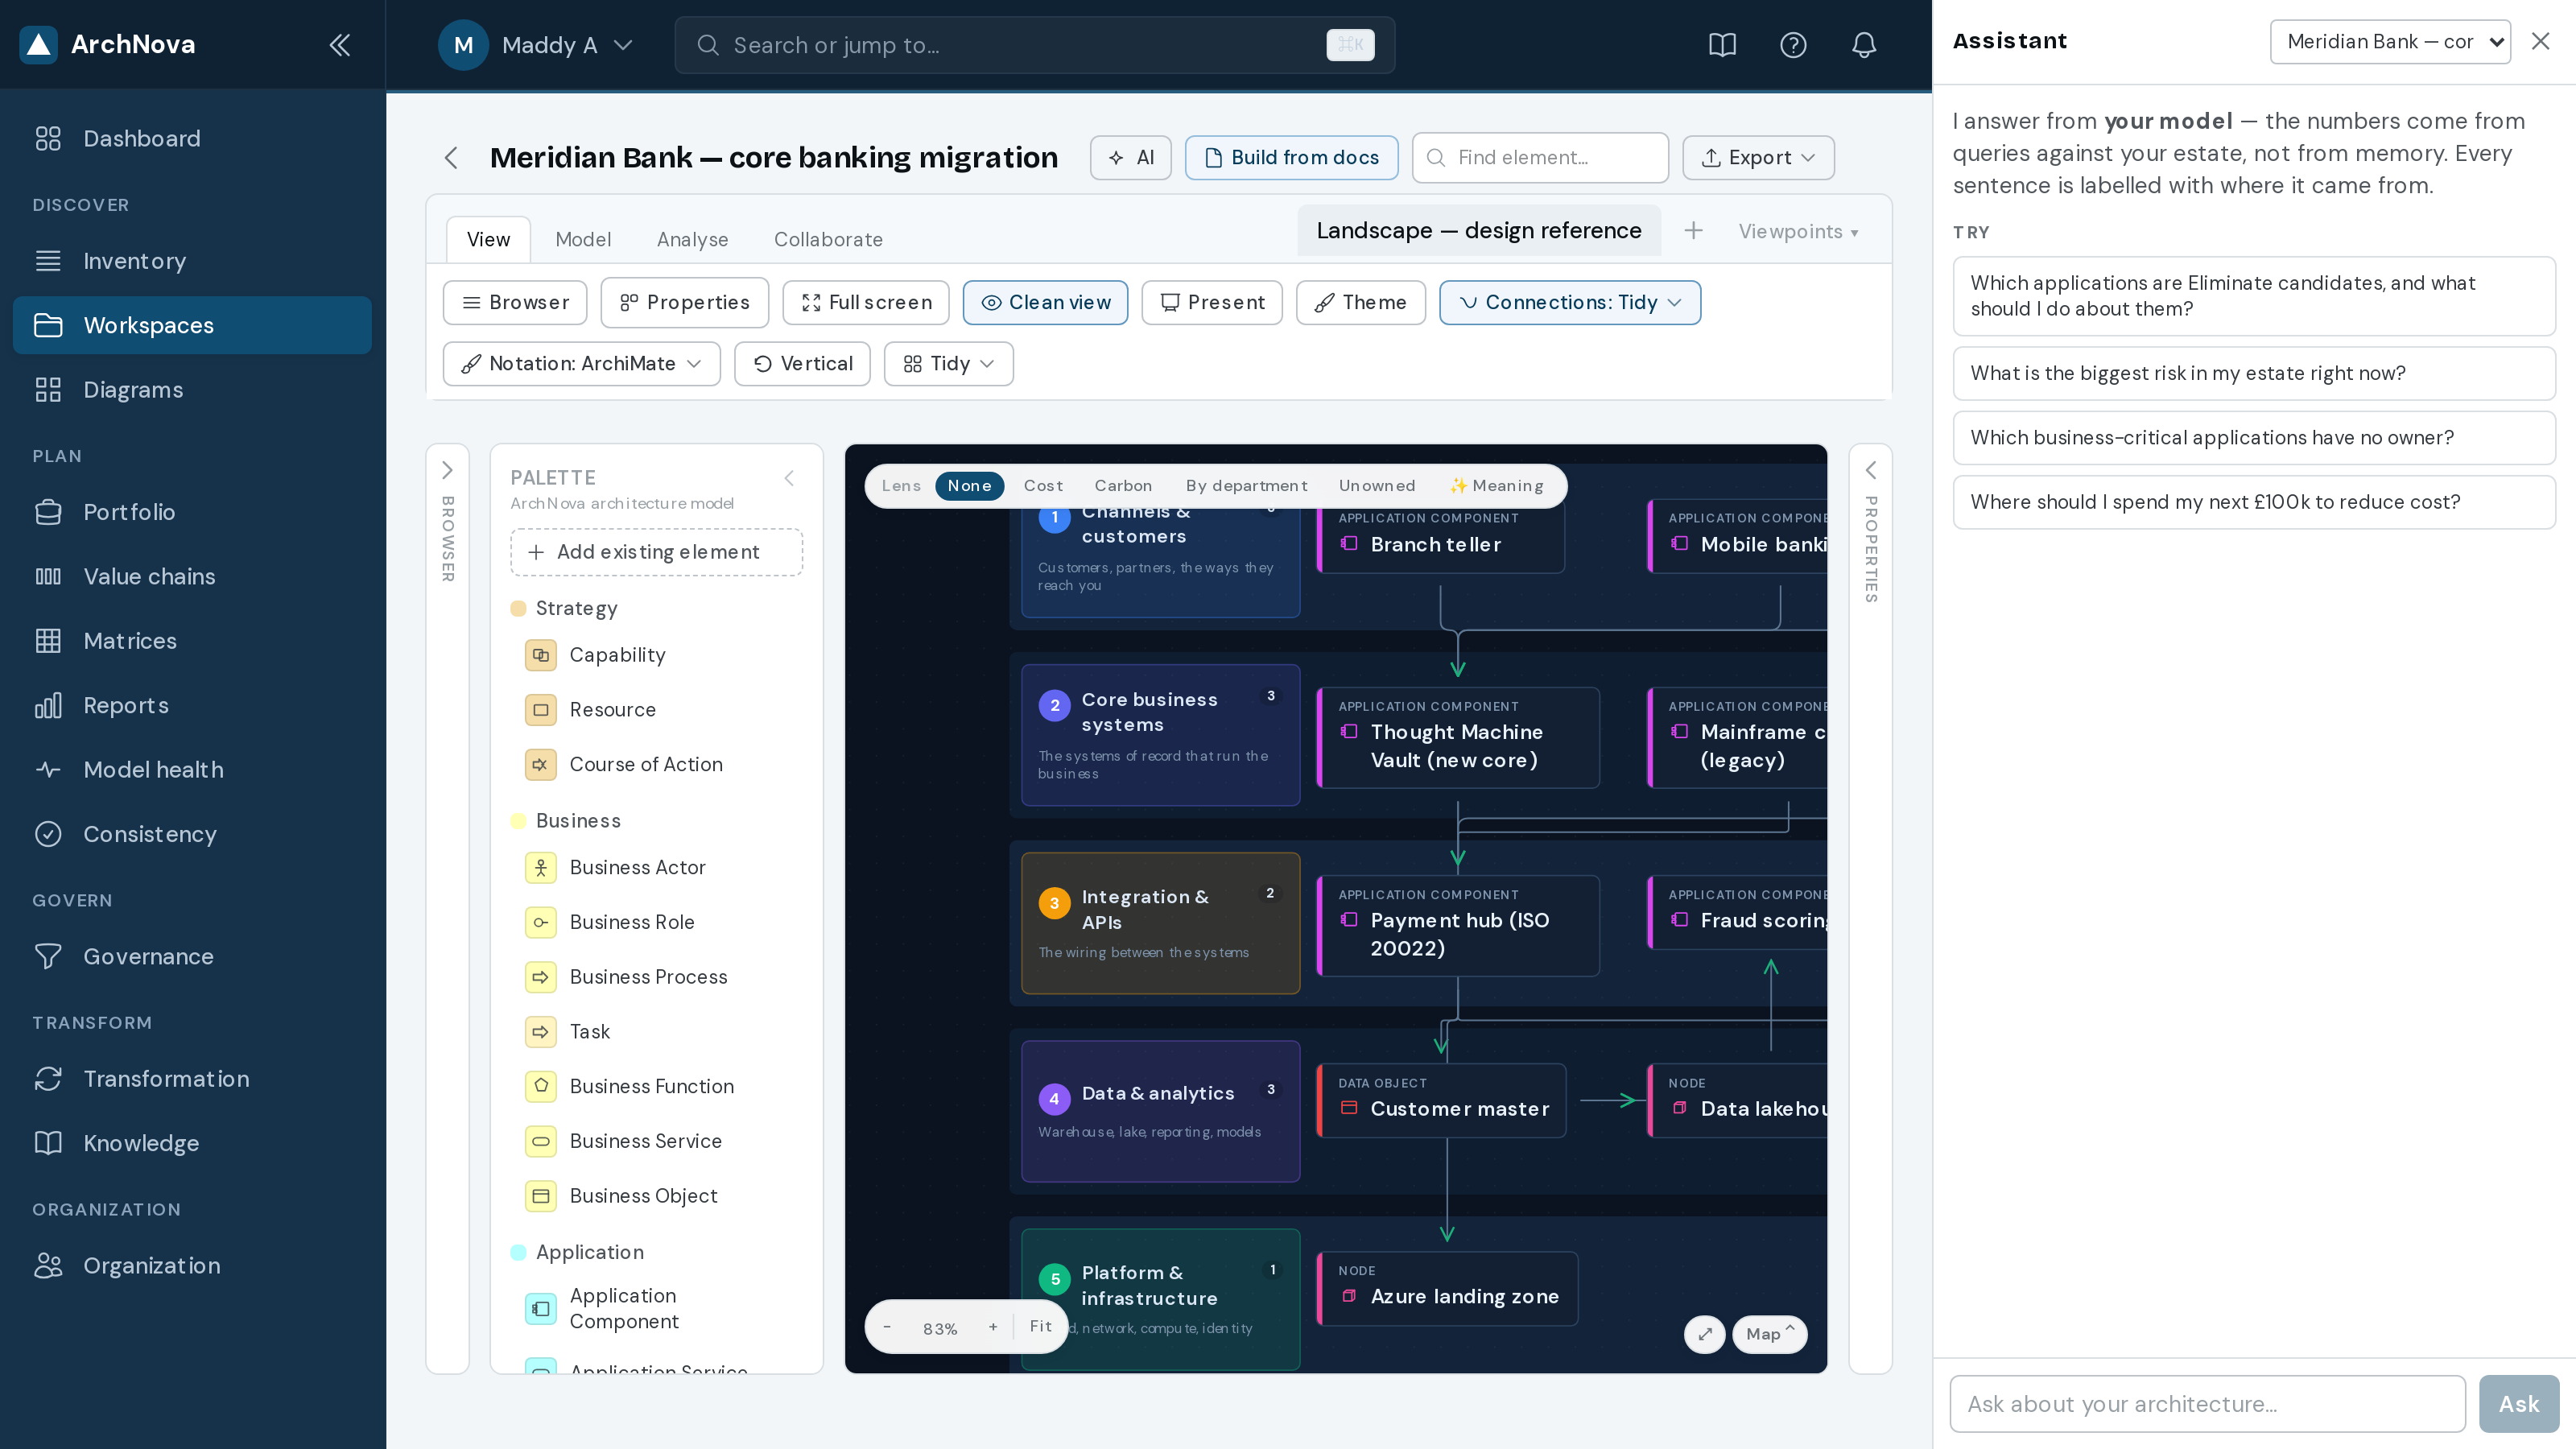
The canvas is where the model is drawn and read. Open Meridian and you get its landscape: five bands running from the customer down to infrastructure.
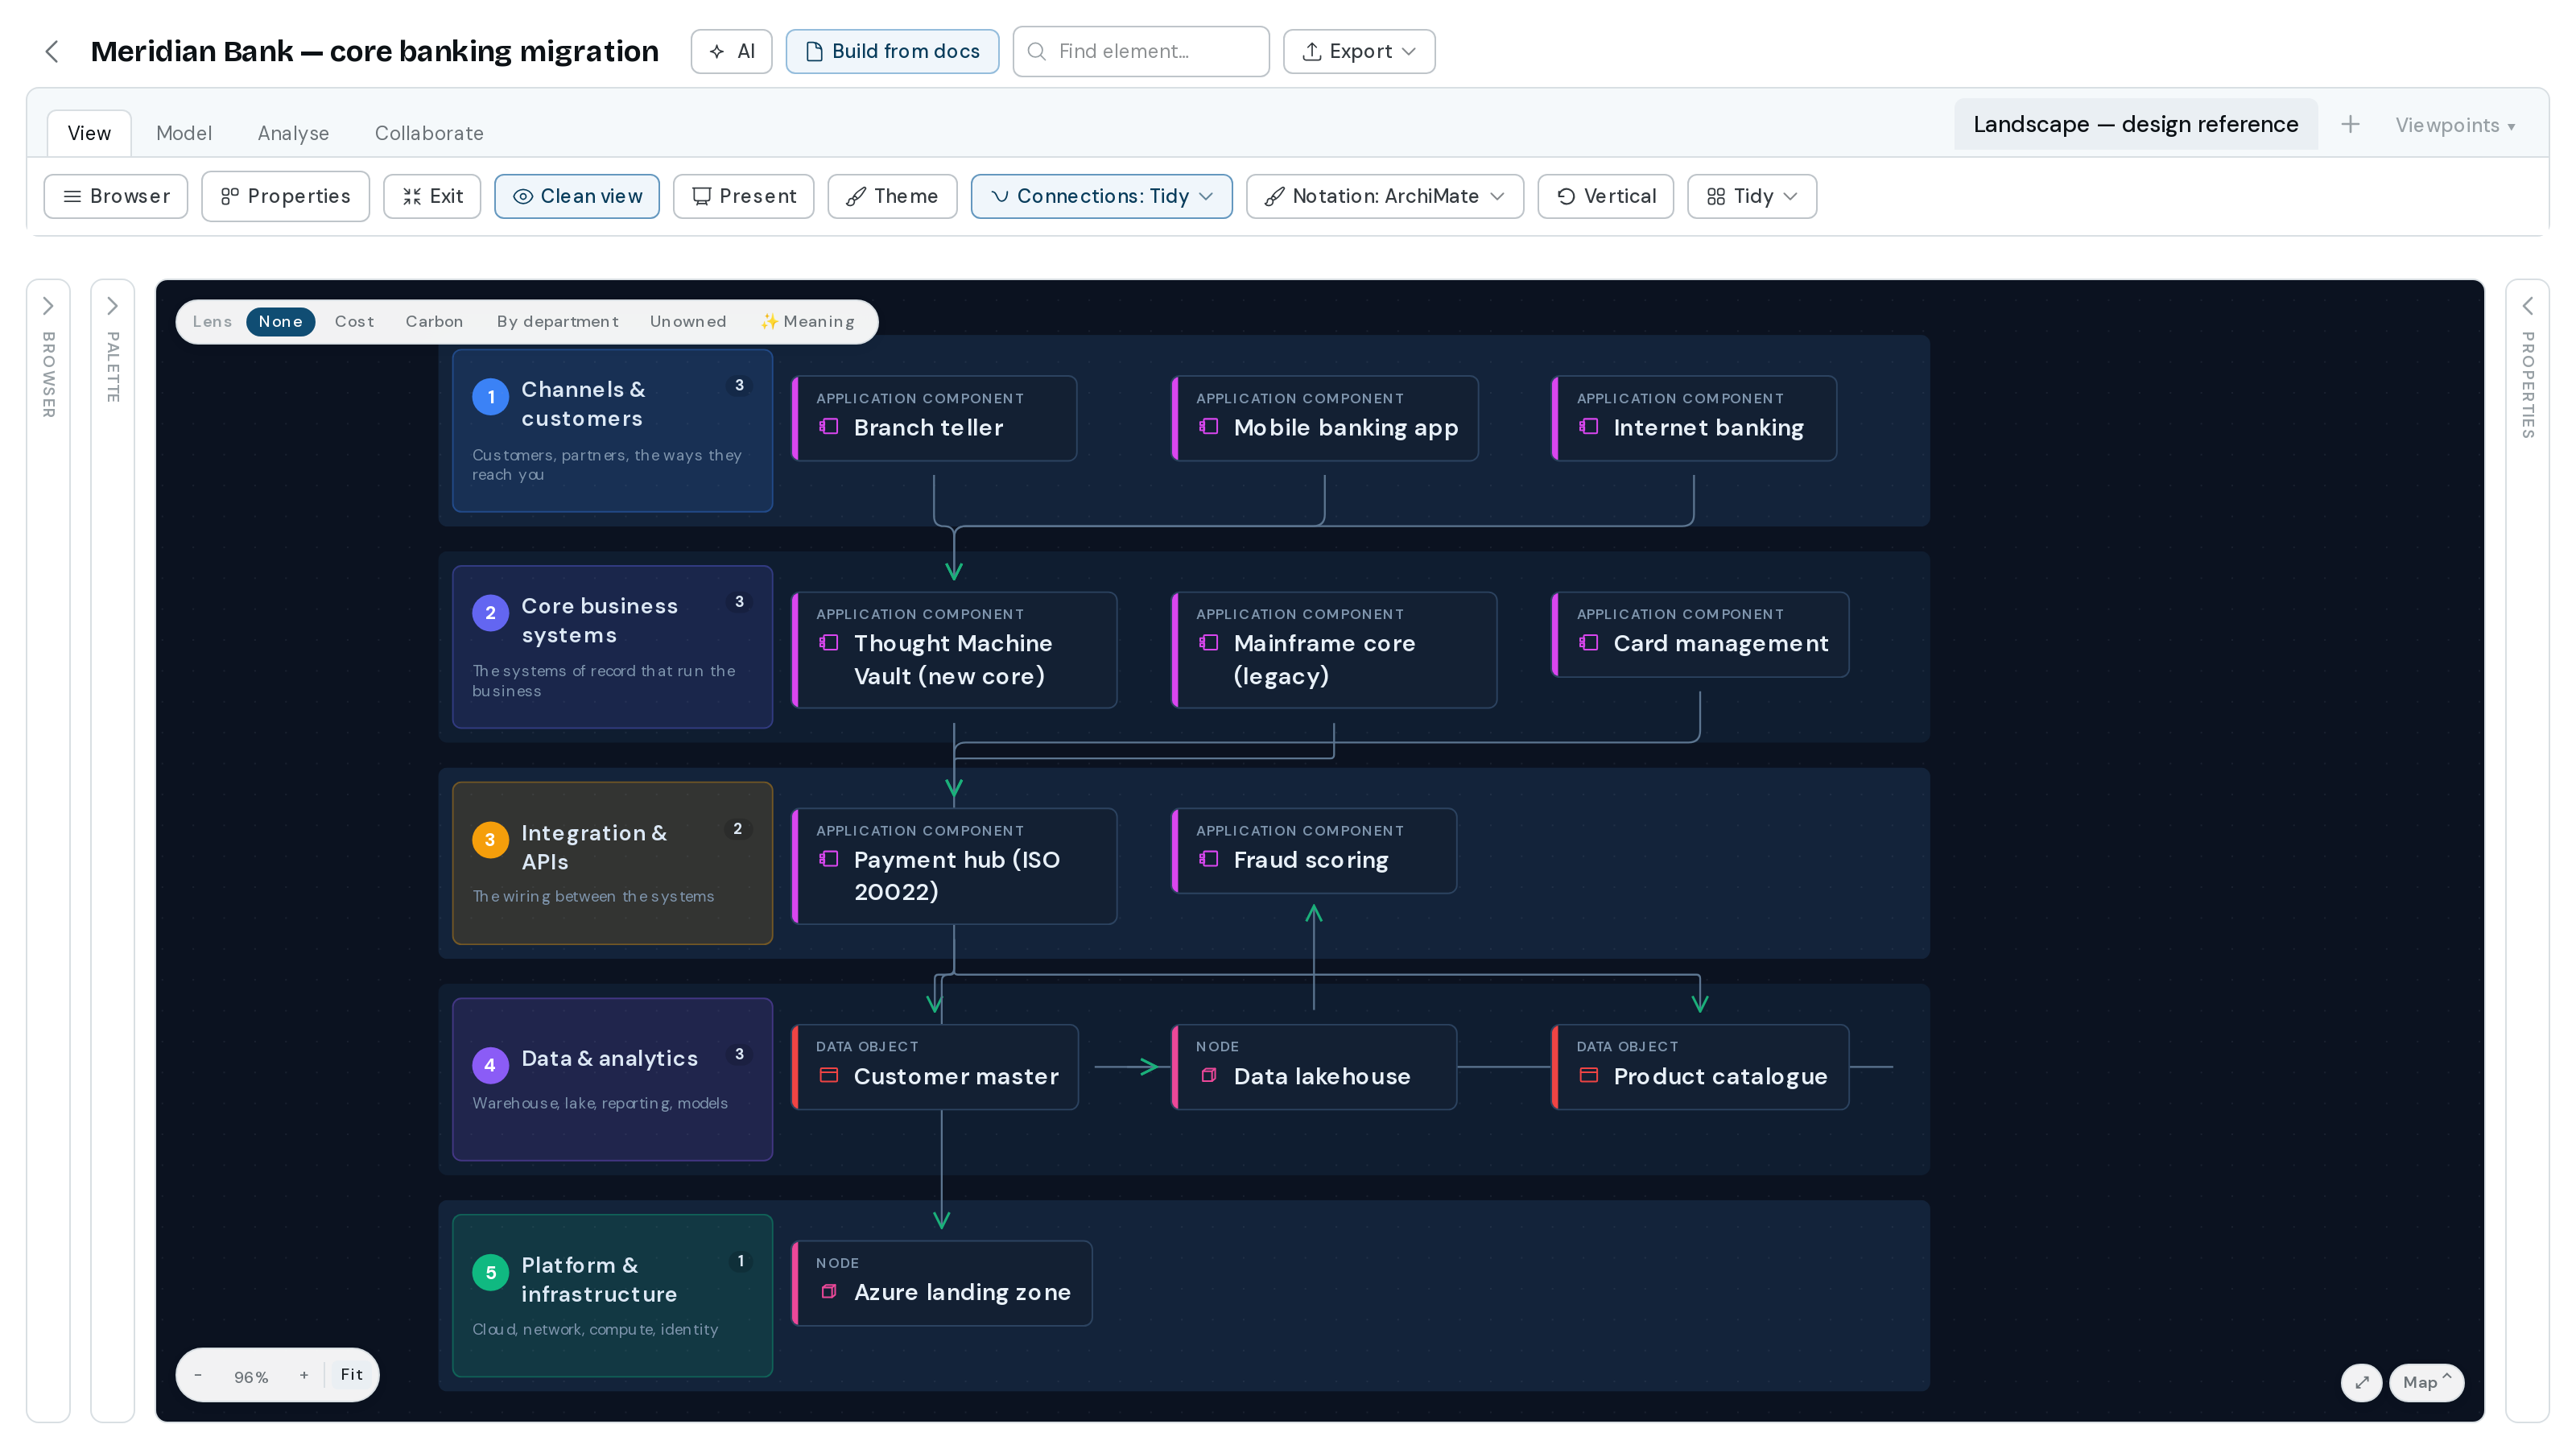
The toolbar is grouped into four sets. Click a group name to reveal its controls:
| Group | Contains |
|---|---|
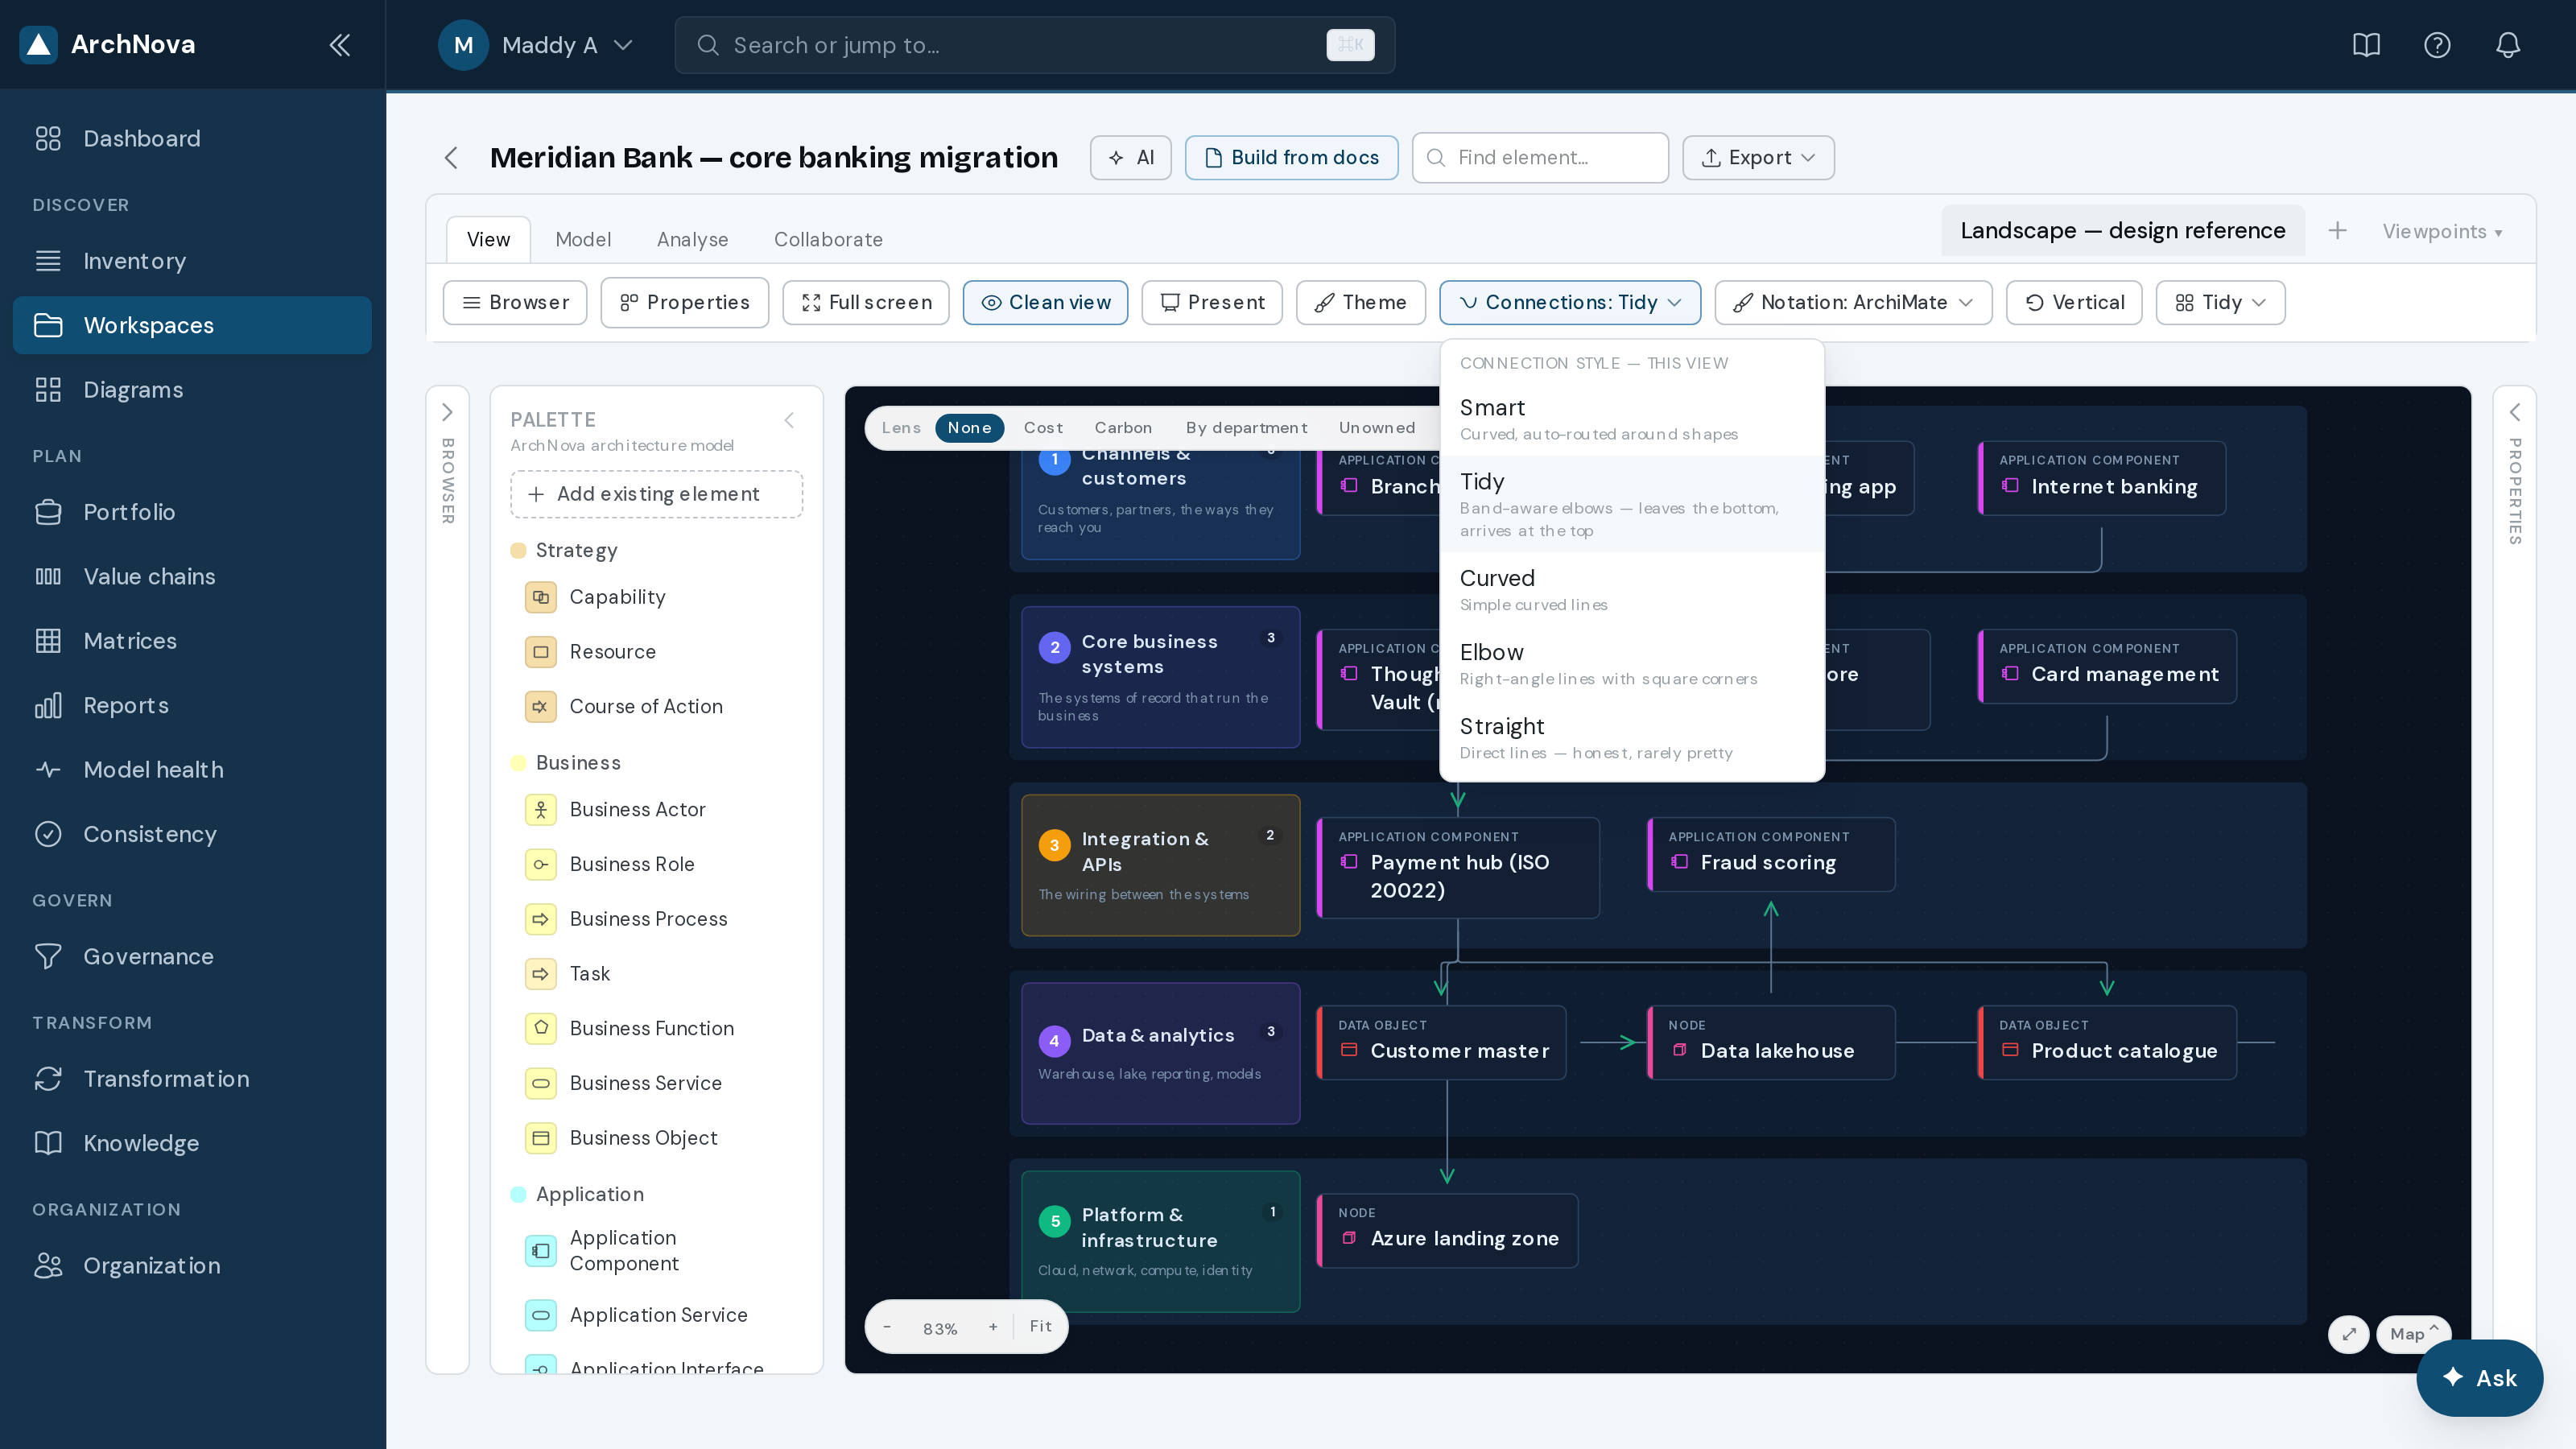
| View | Browser, Properties, Full screen, Clean view, Present, Theme, Connections, Notation, layout direction, Tidy. |
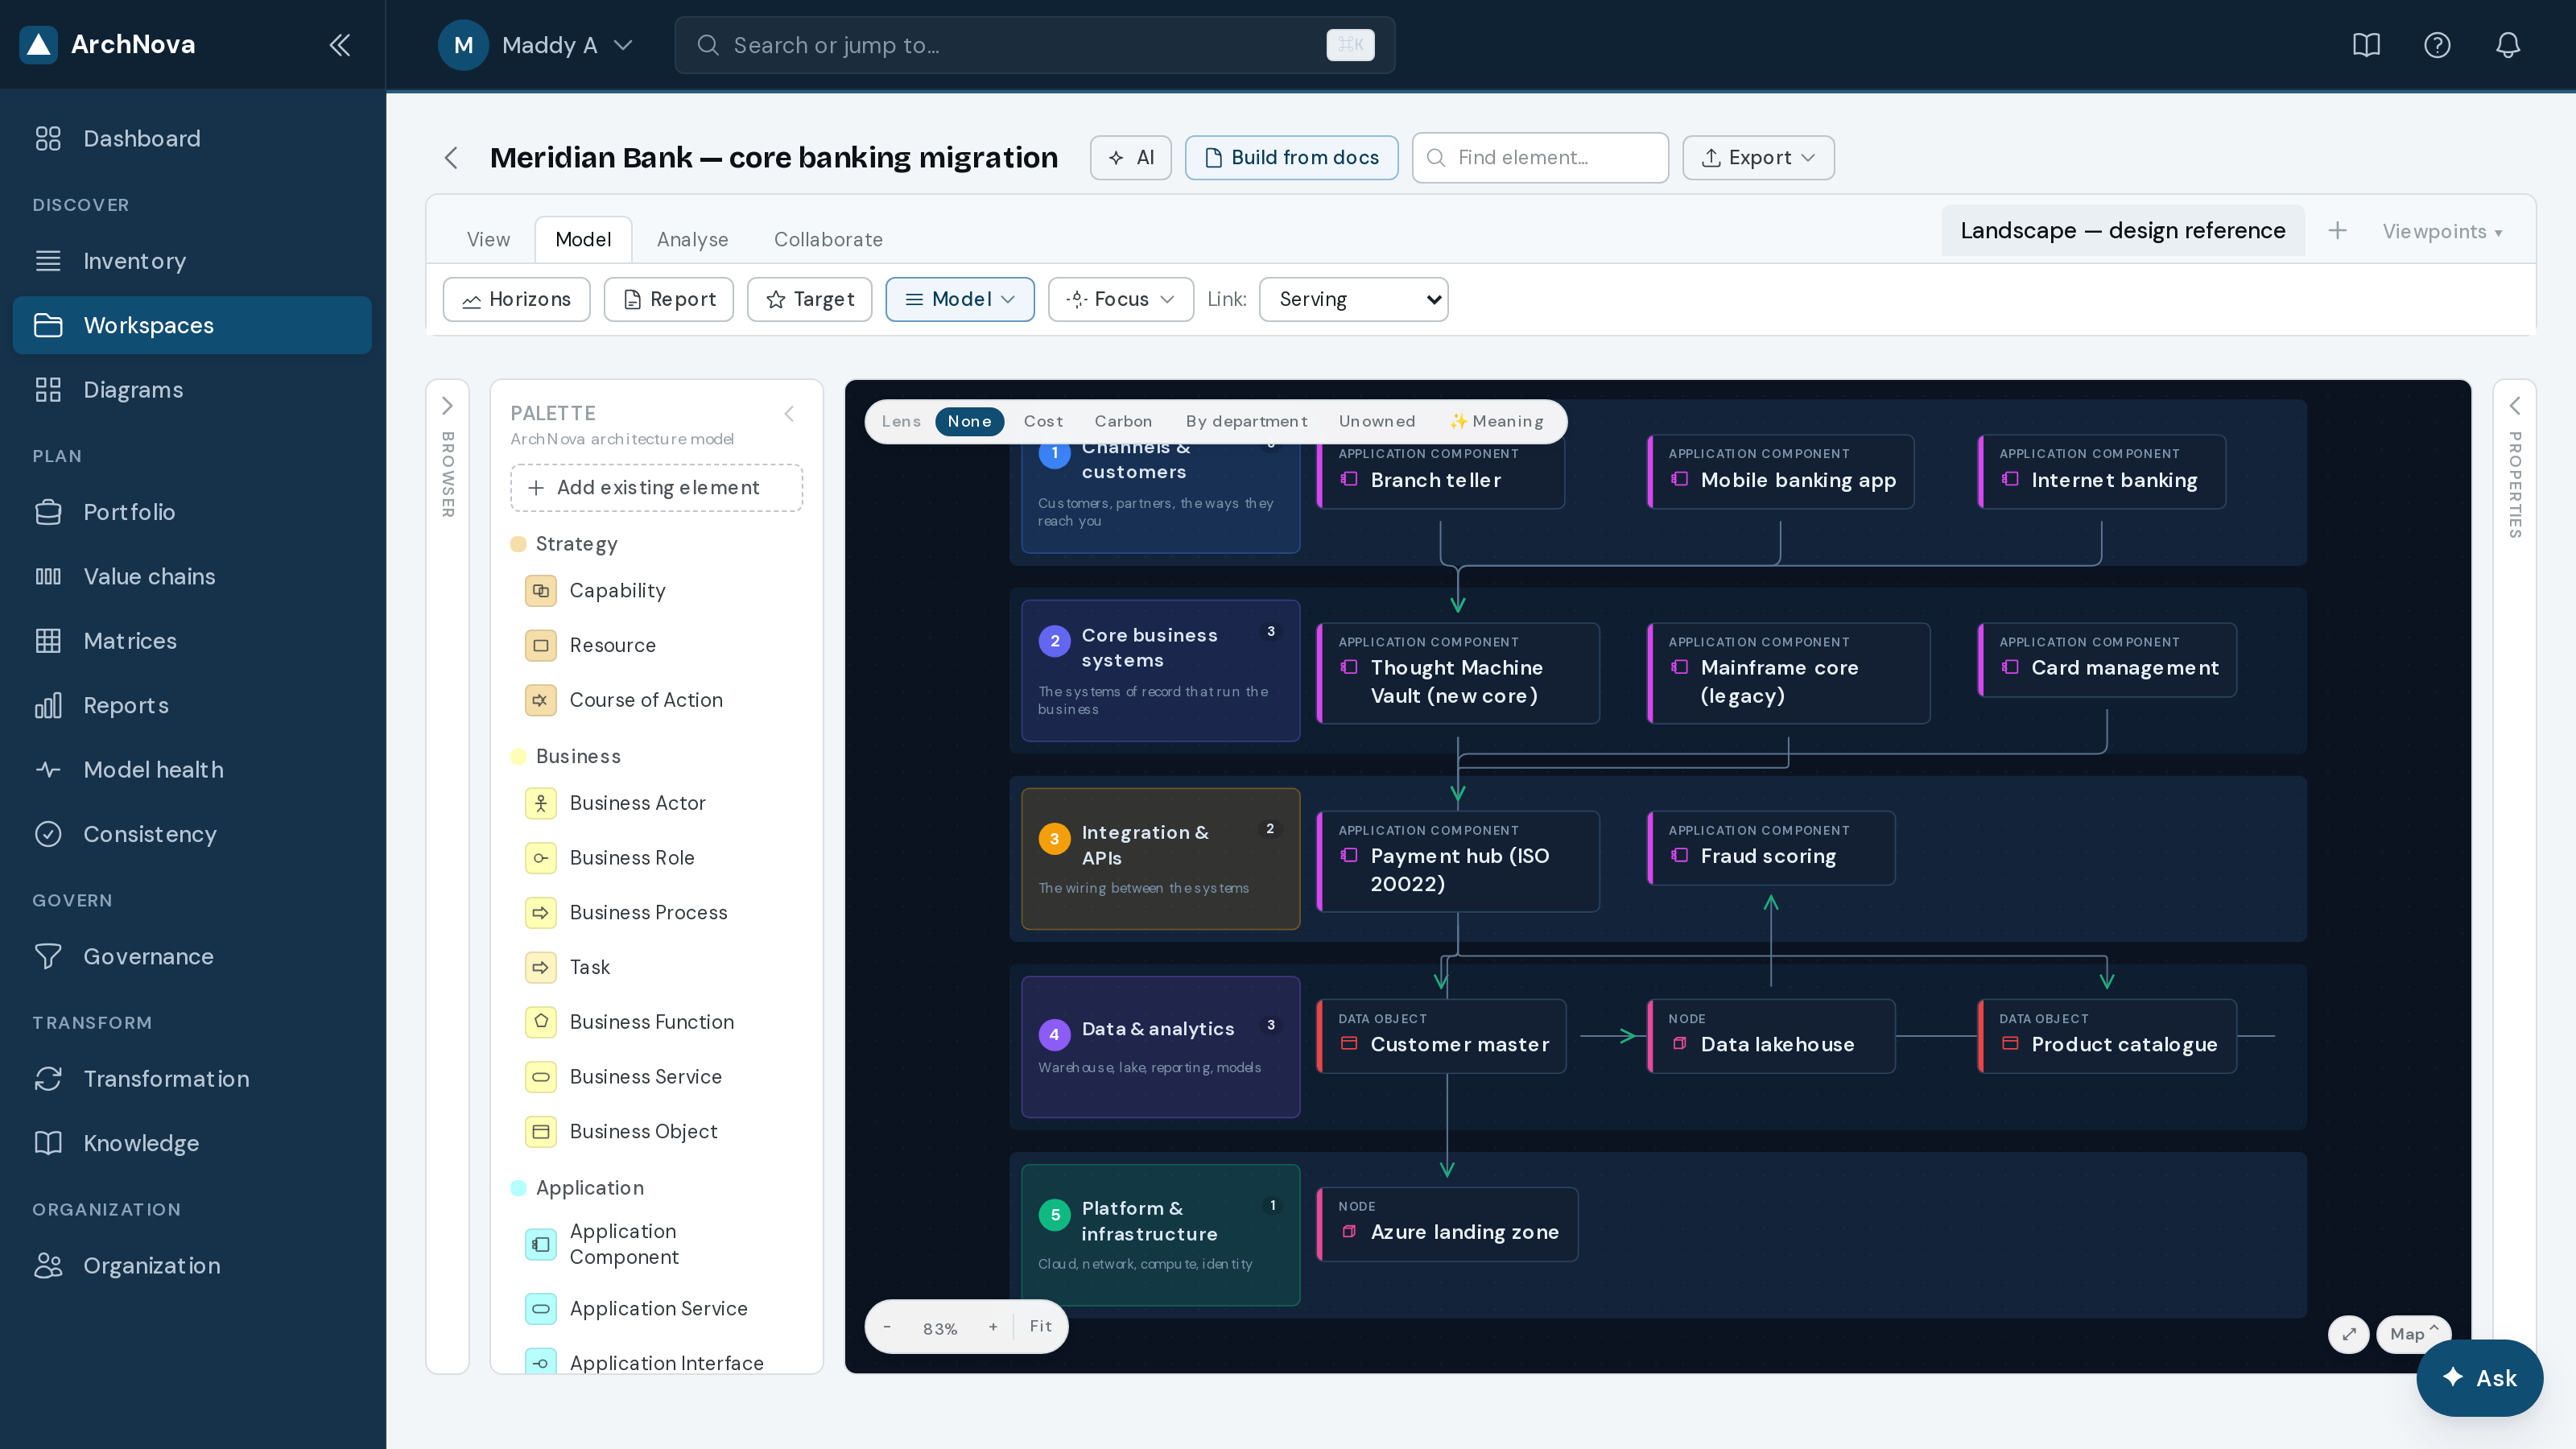
| Model | Horizons, Report, Target, Focus, and the zone model that bands the landscape. |
| Analyse | The lenses — cost, carbon, department, ownership, meaning. |
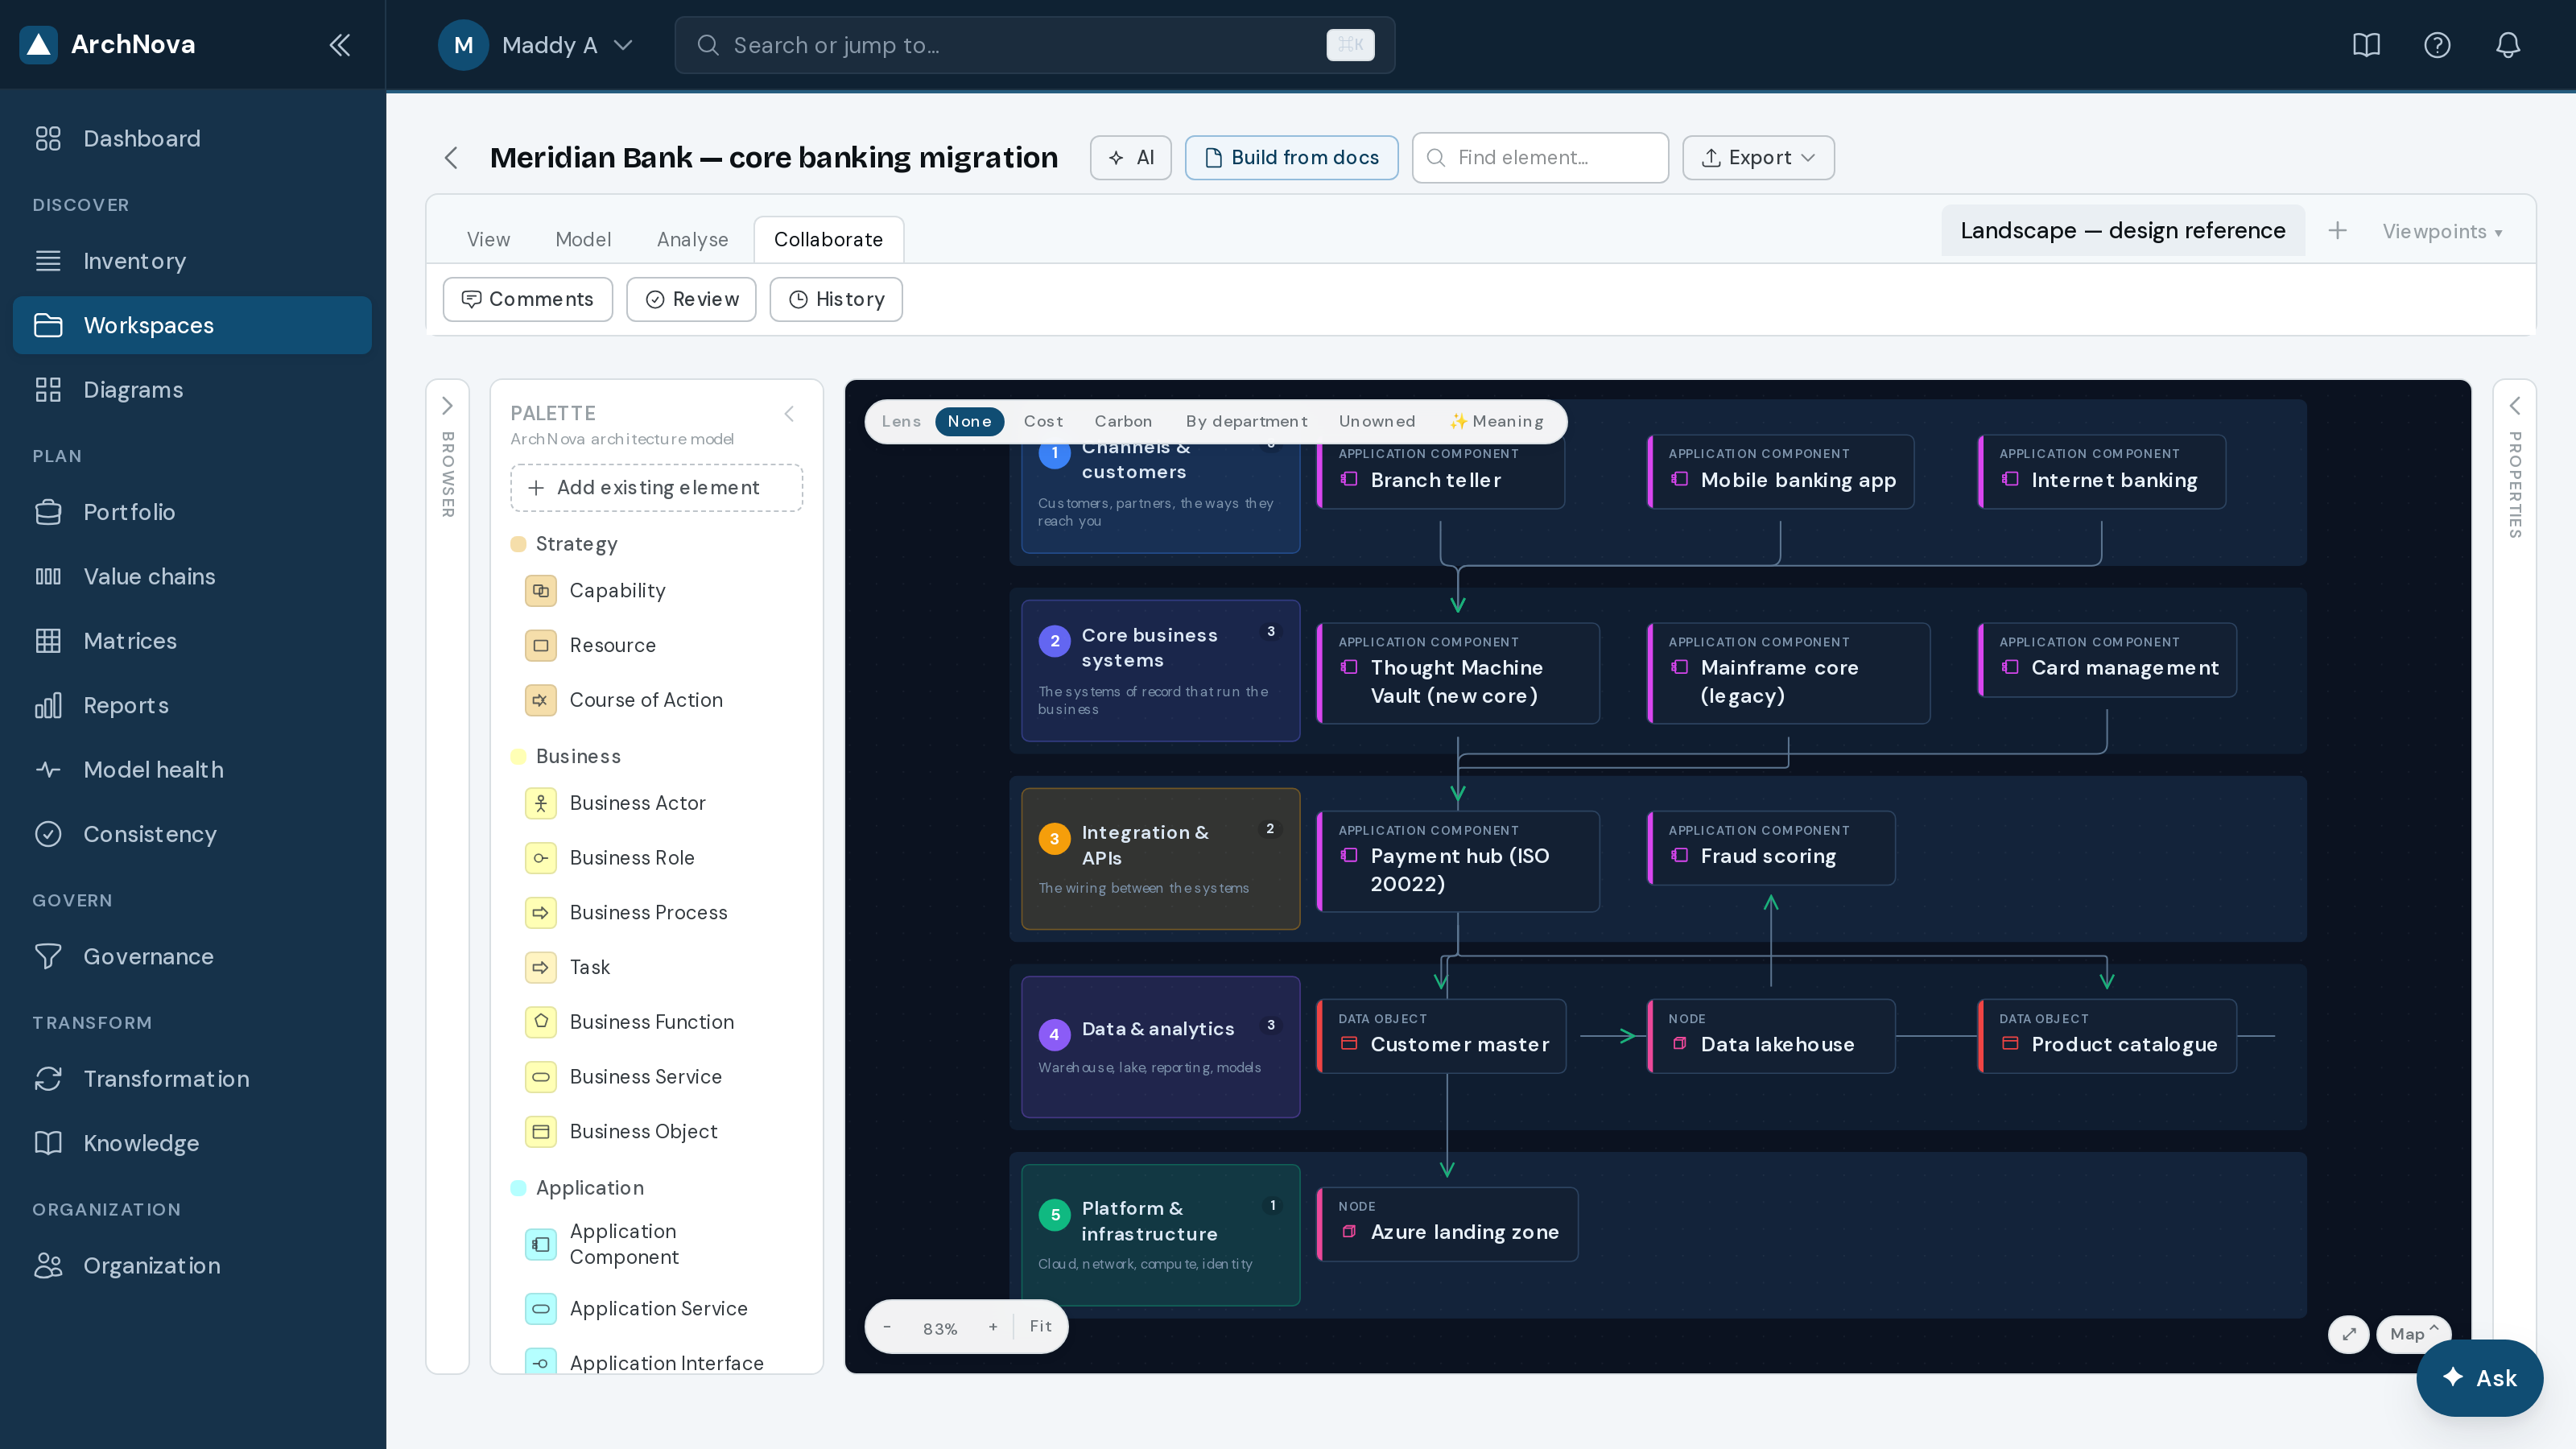
| Collaborate | Comments, Review, History. |
Adding to the model
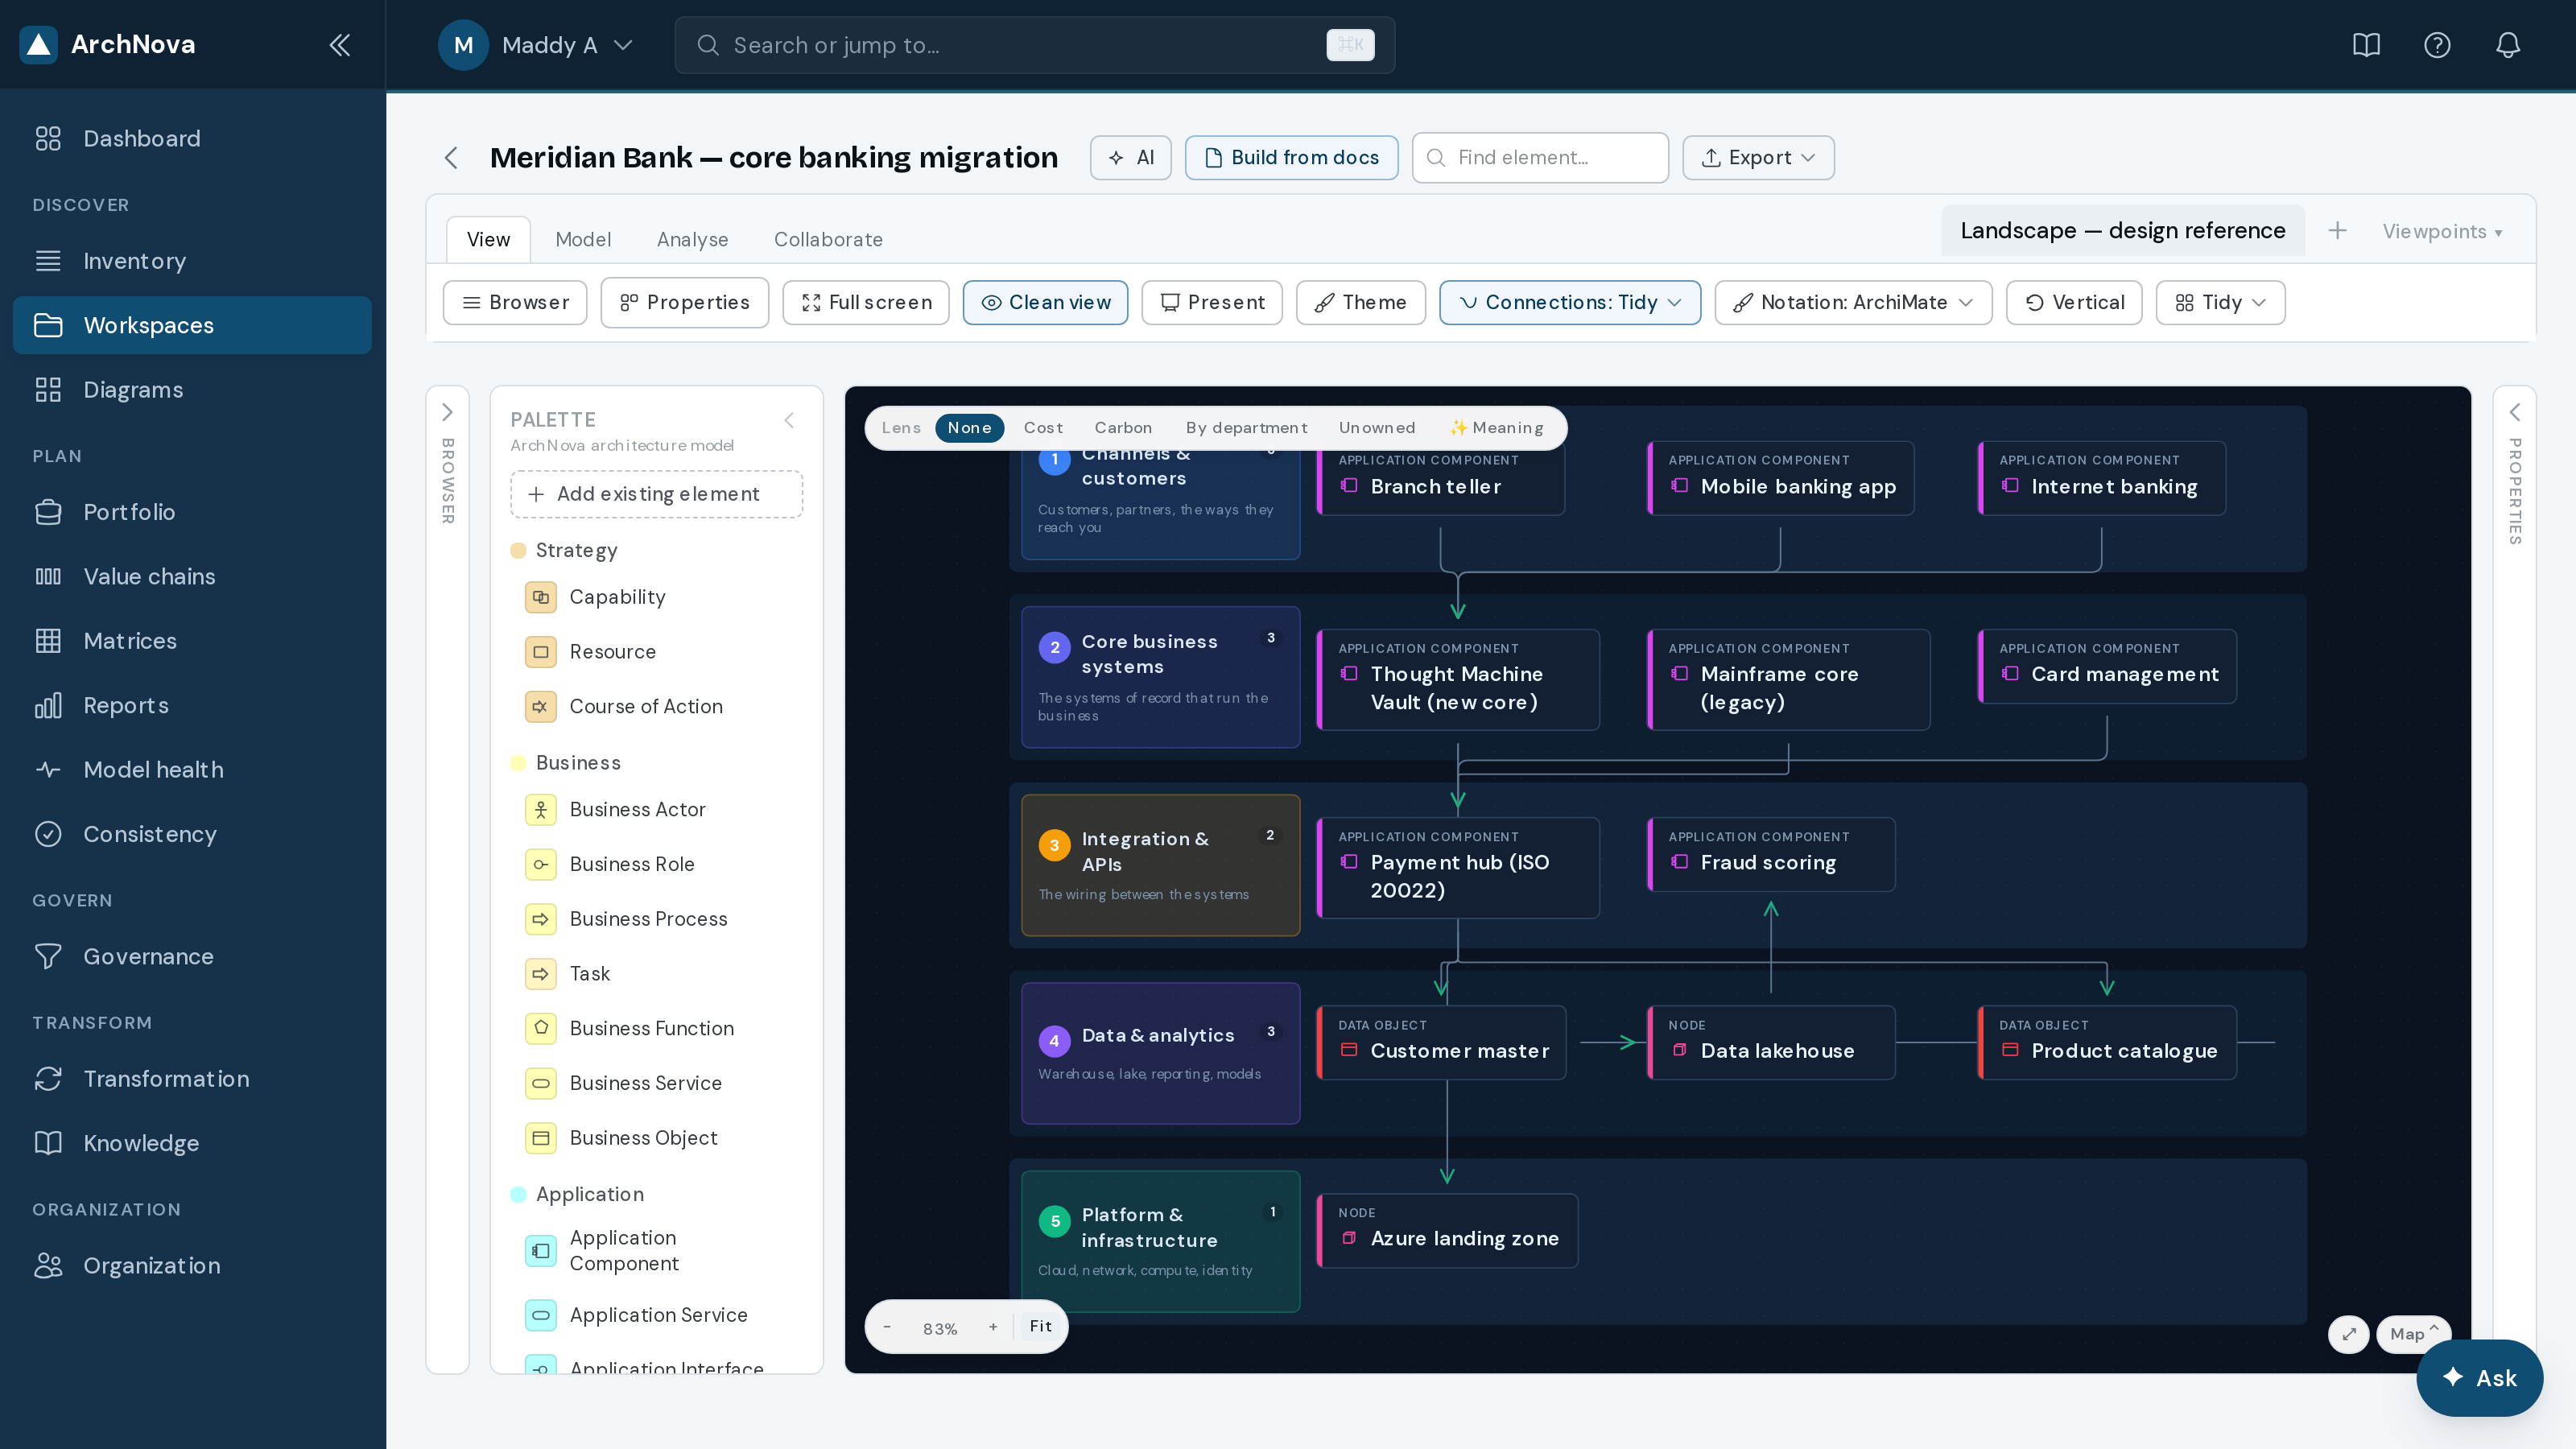
- Drag a type from the palette onto the canvas, or use Add existing element to place something already in the model.
- Drag from the edge of one node to another to create a relationship; pick the type when prompted.
- Tidy re-lays out the diagram; the direction control switches between vertical and horizontal flow.
Reading and editing one element
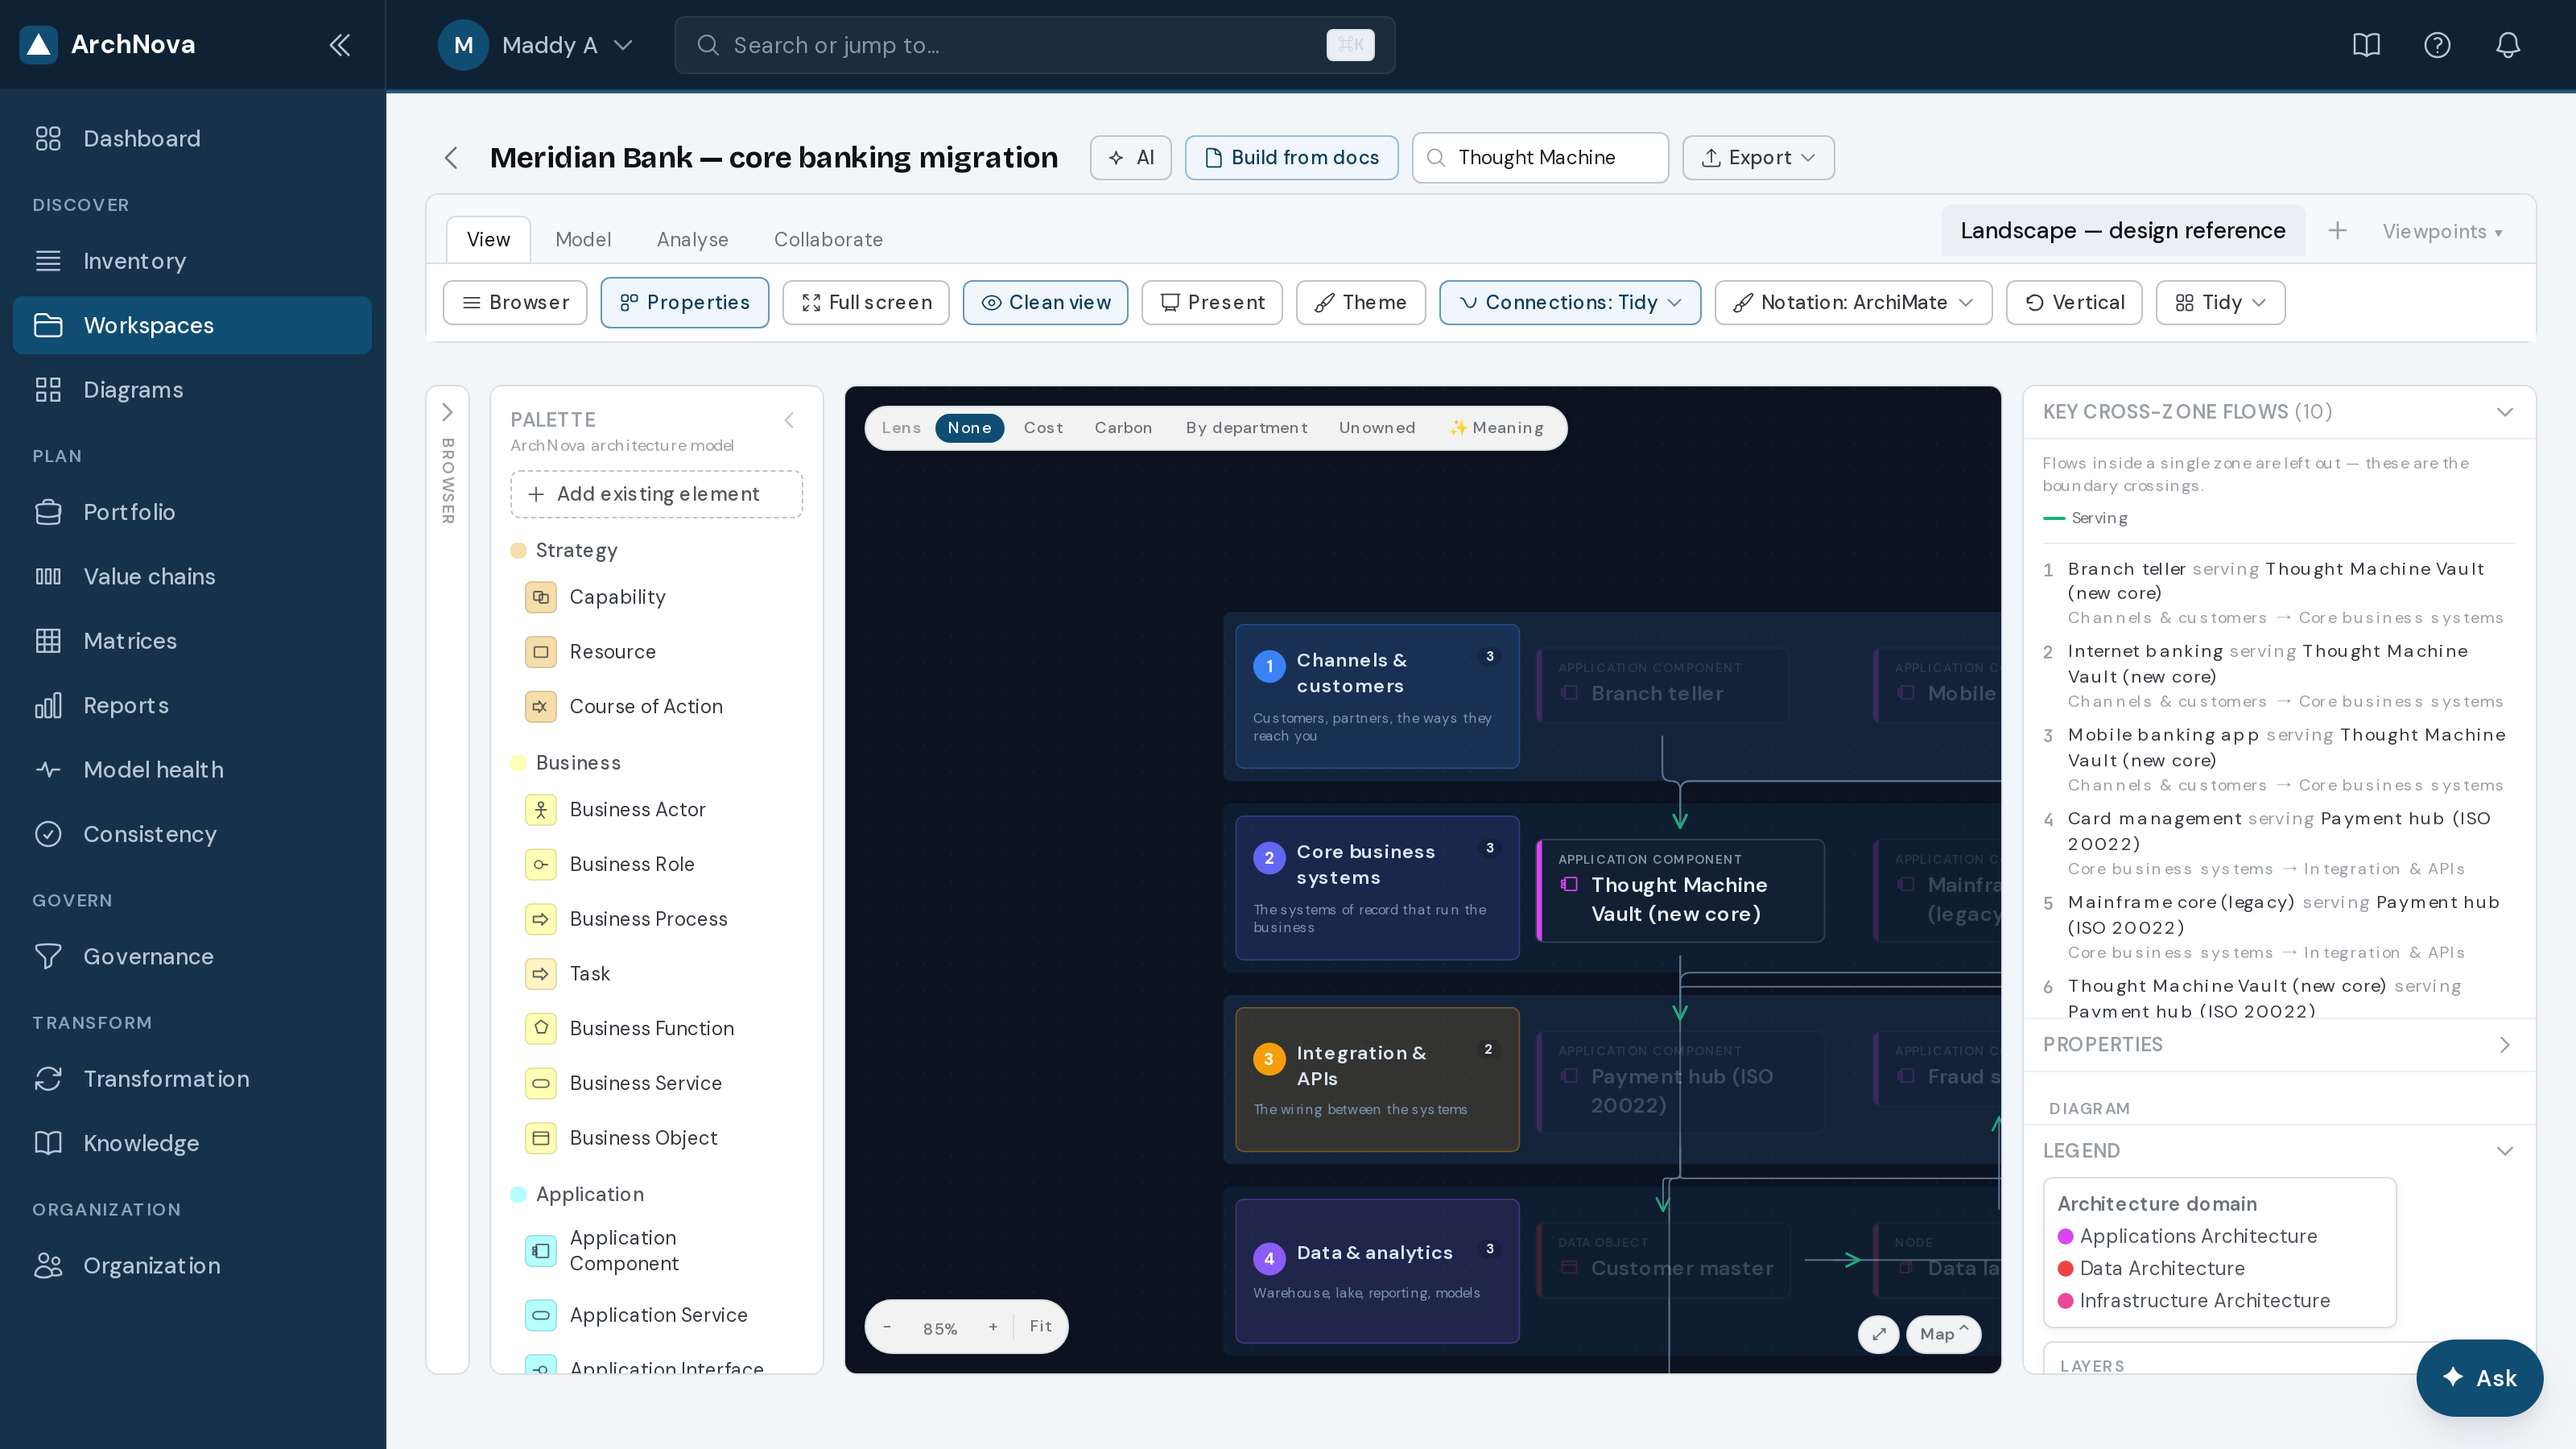
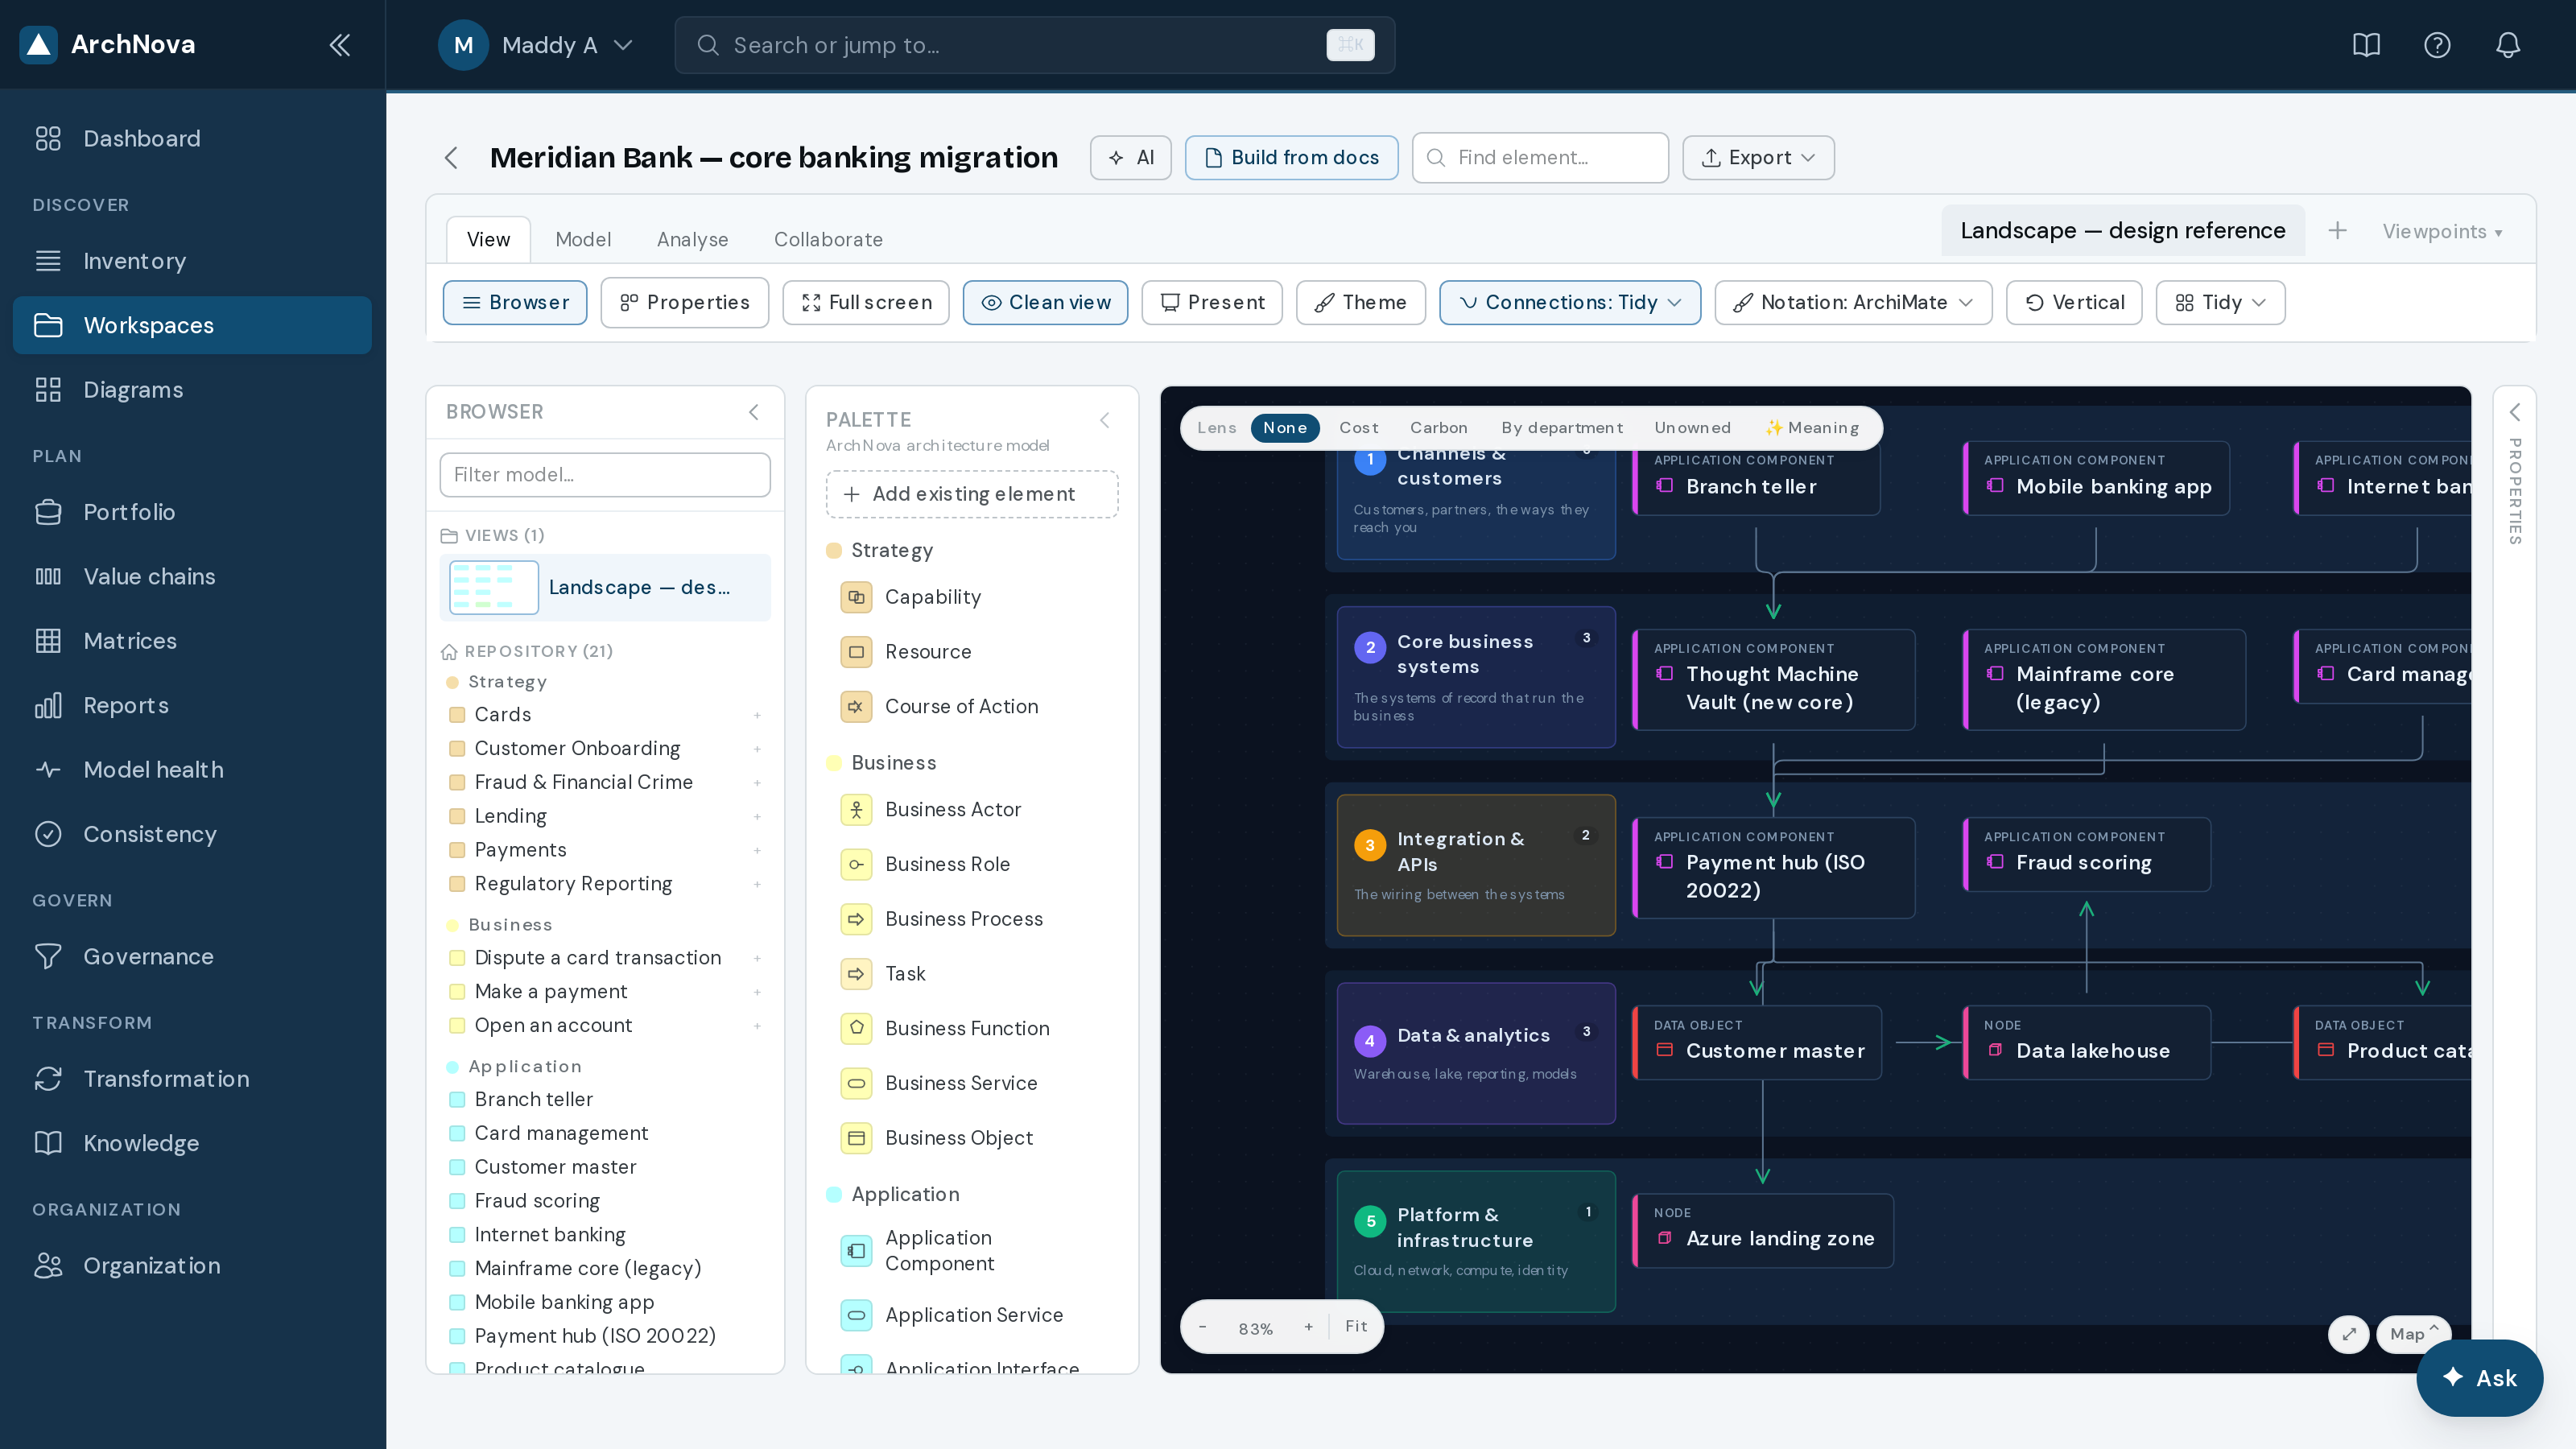
Use Find element… in the header to jump straight to something by name — much faster than hunting on a large canvas.
Navigating a large model
Views and viewpoints
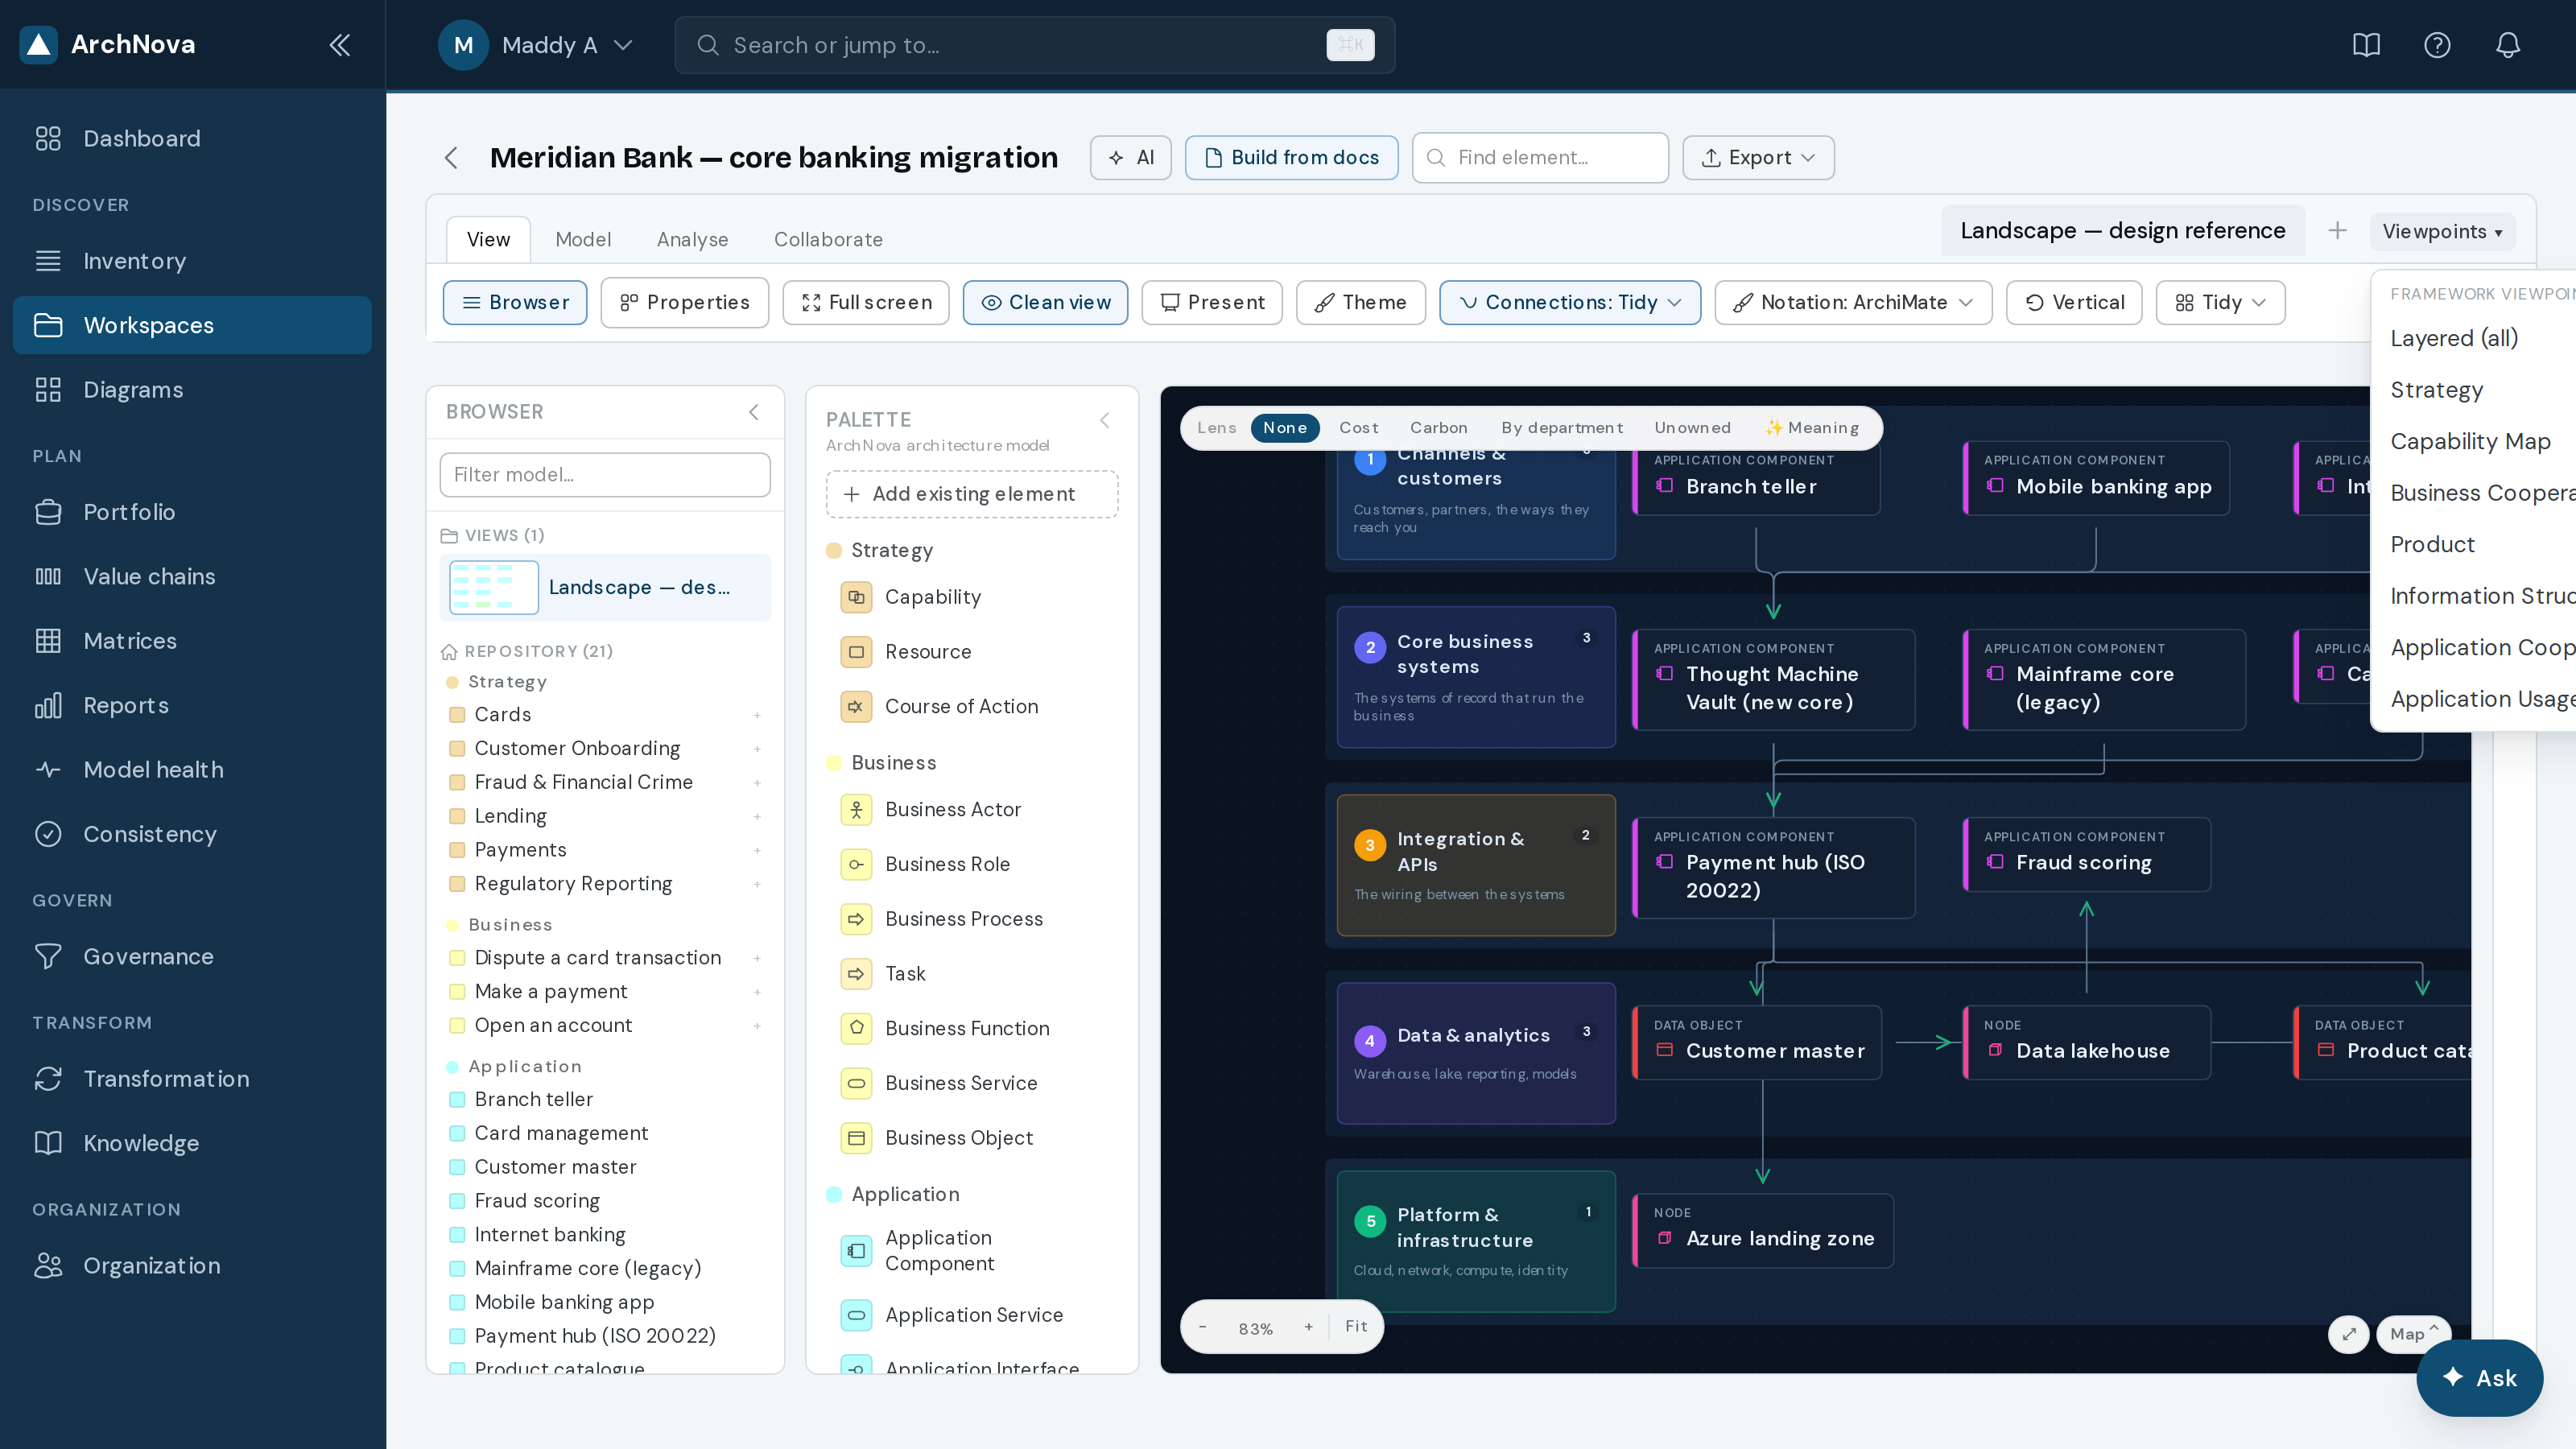
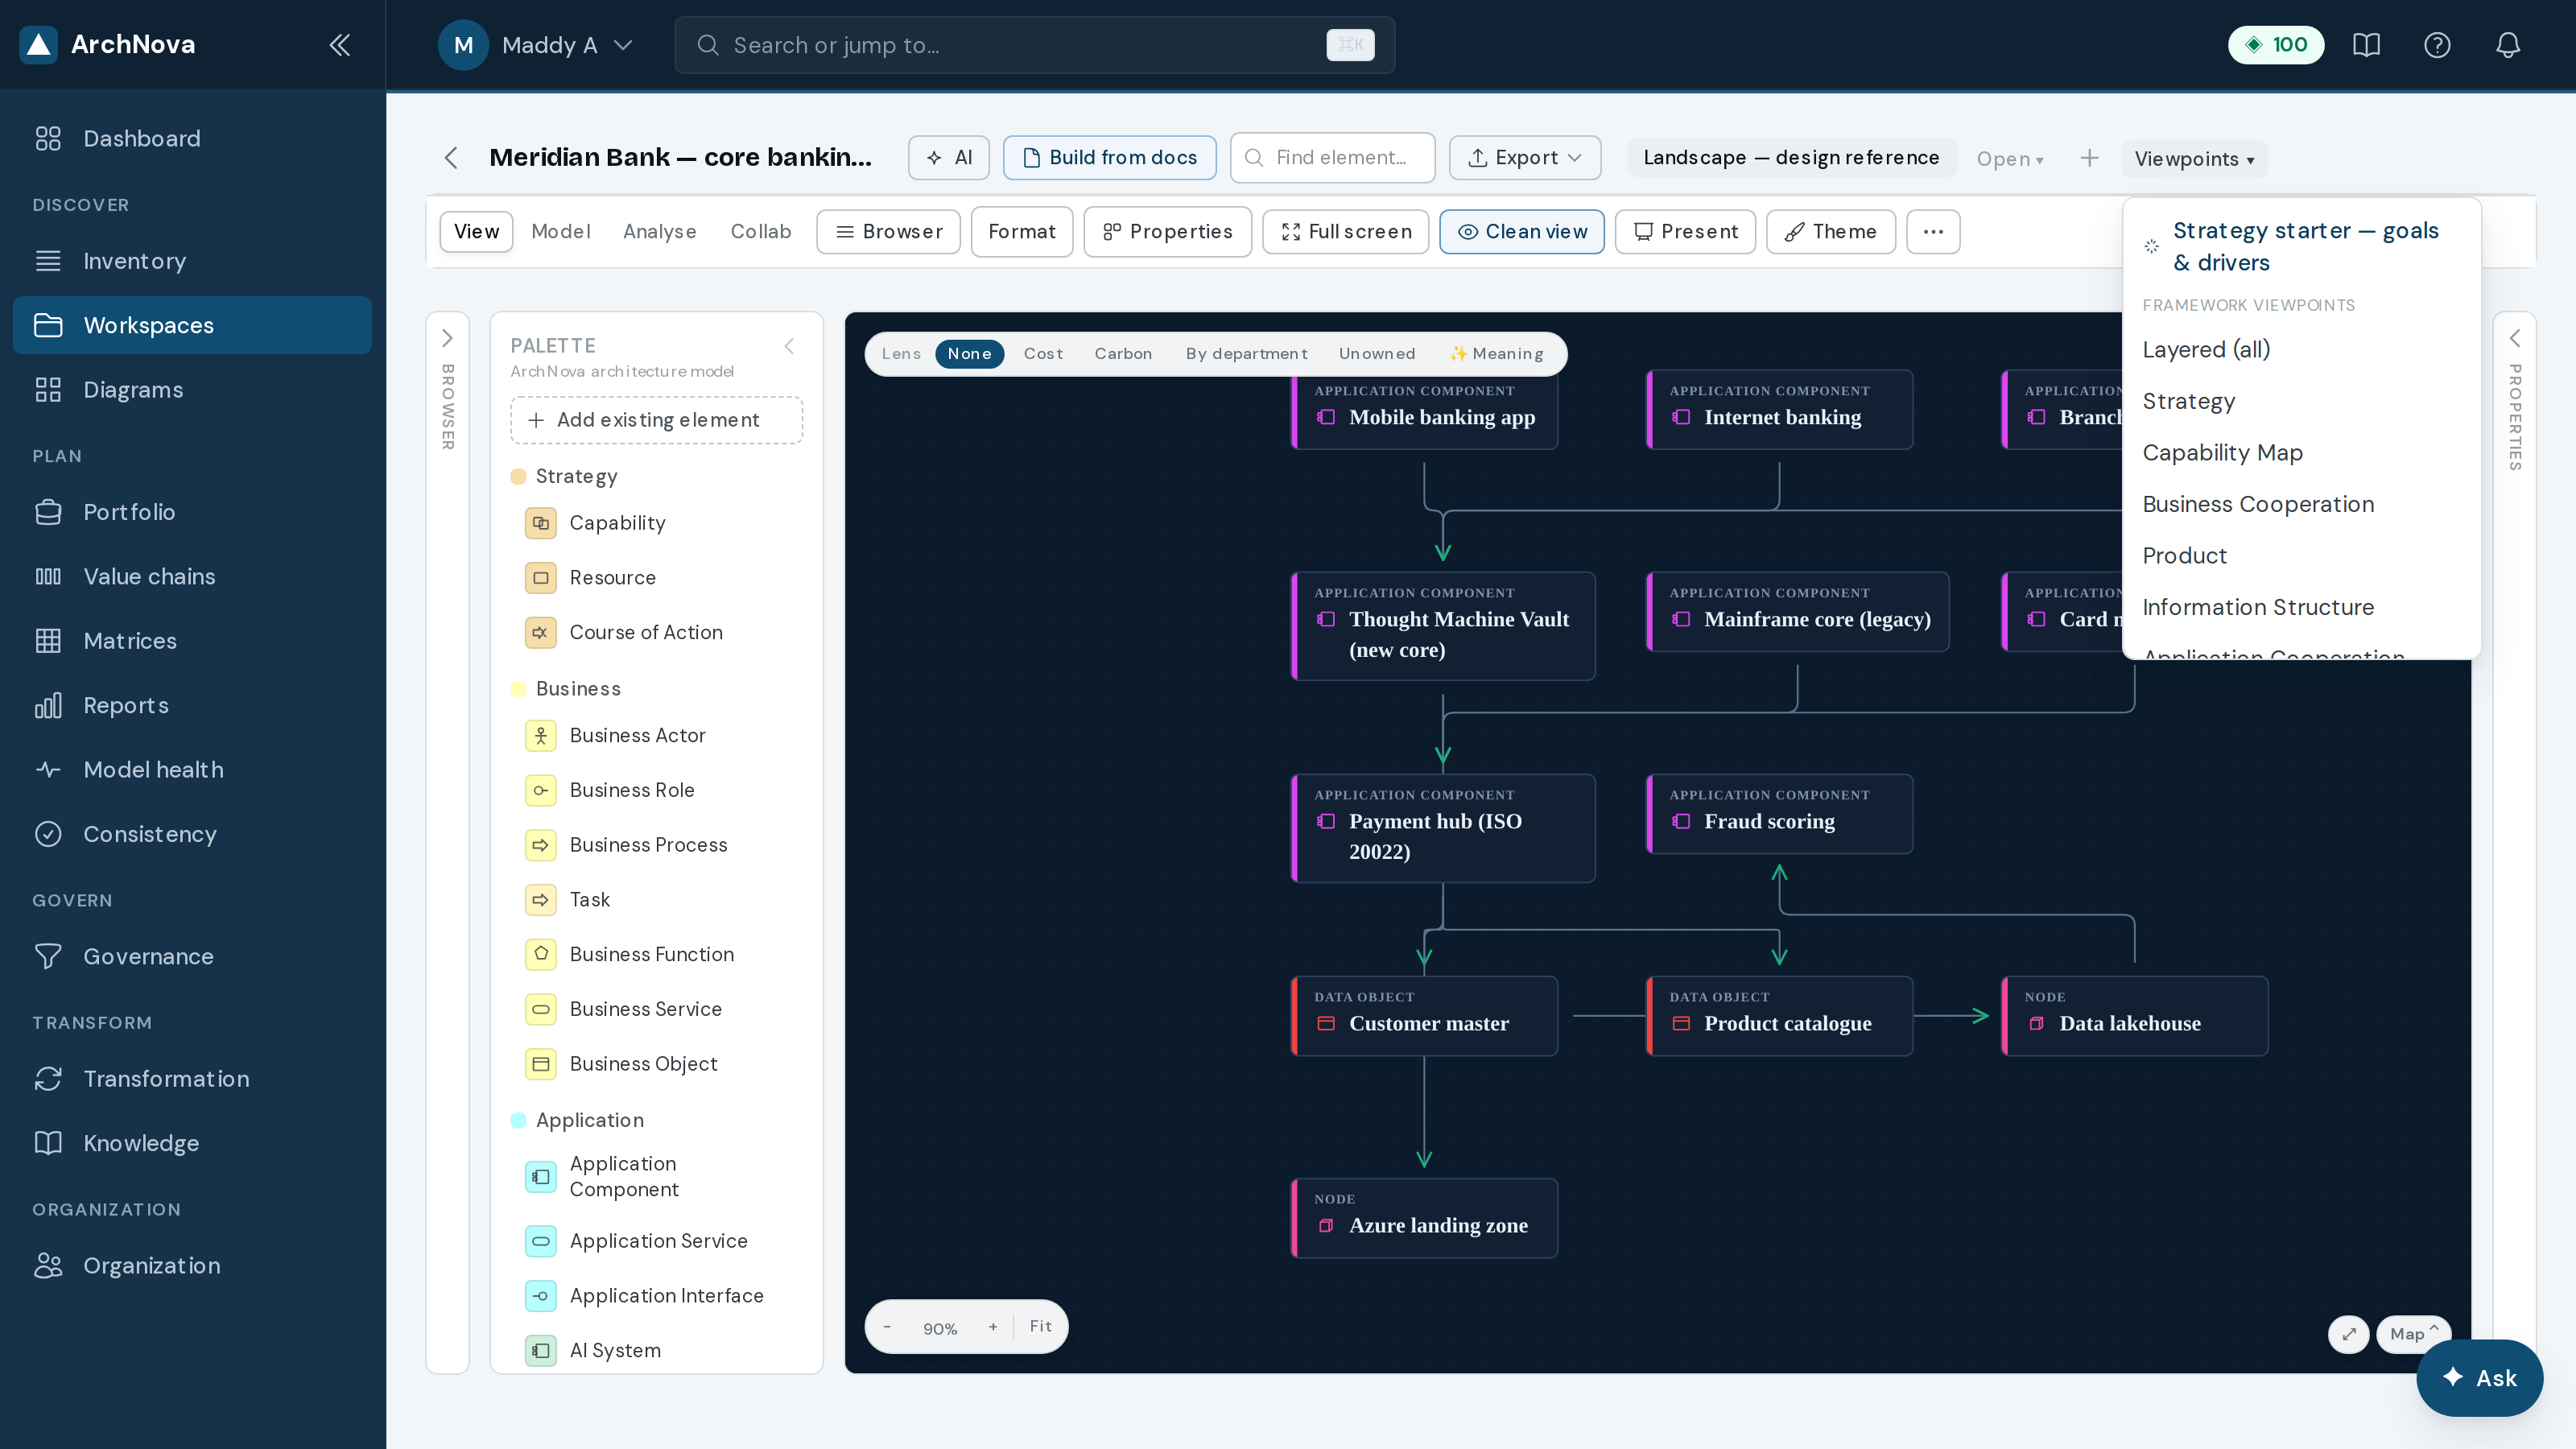
One model, many views. Create a view for a specific conversation (“what the payments board needs to see”) and it stays in the workspace alongside the landscape.
Changing how it looks
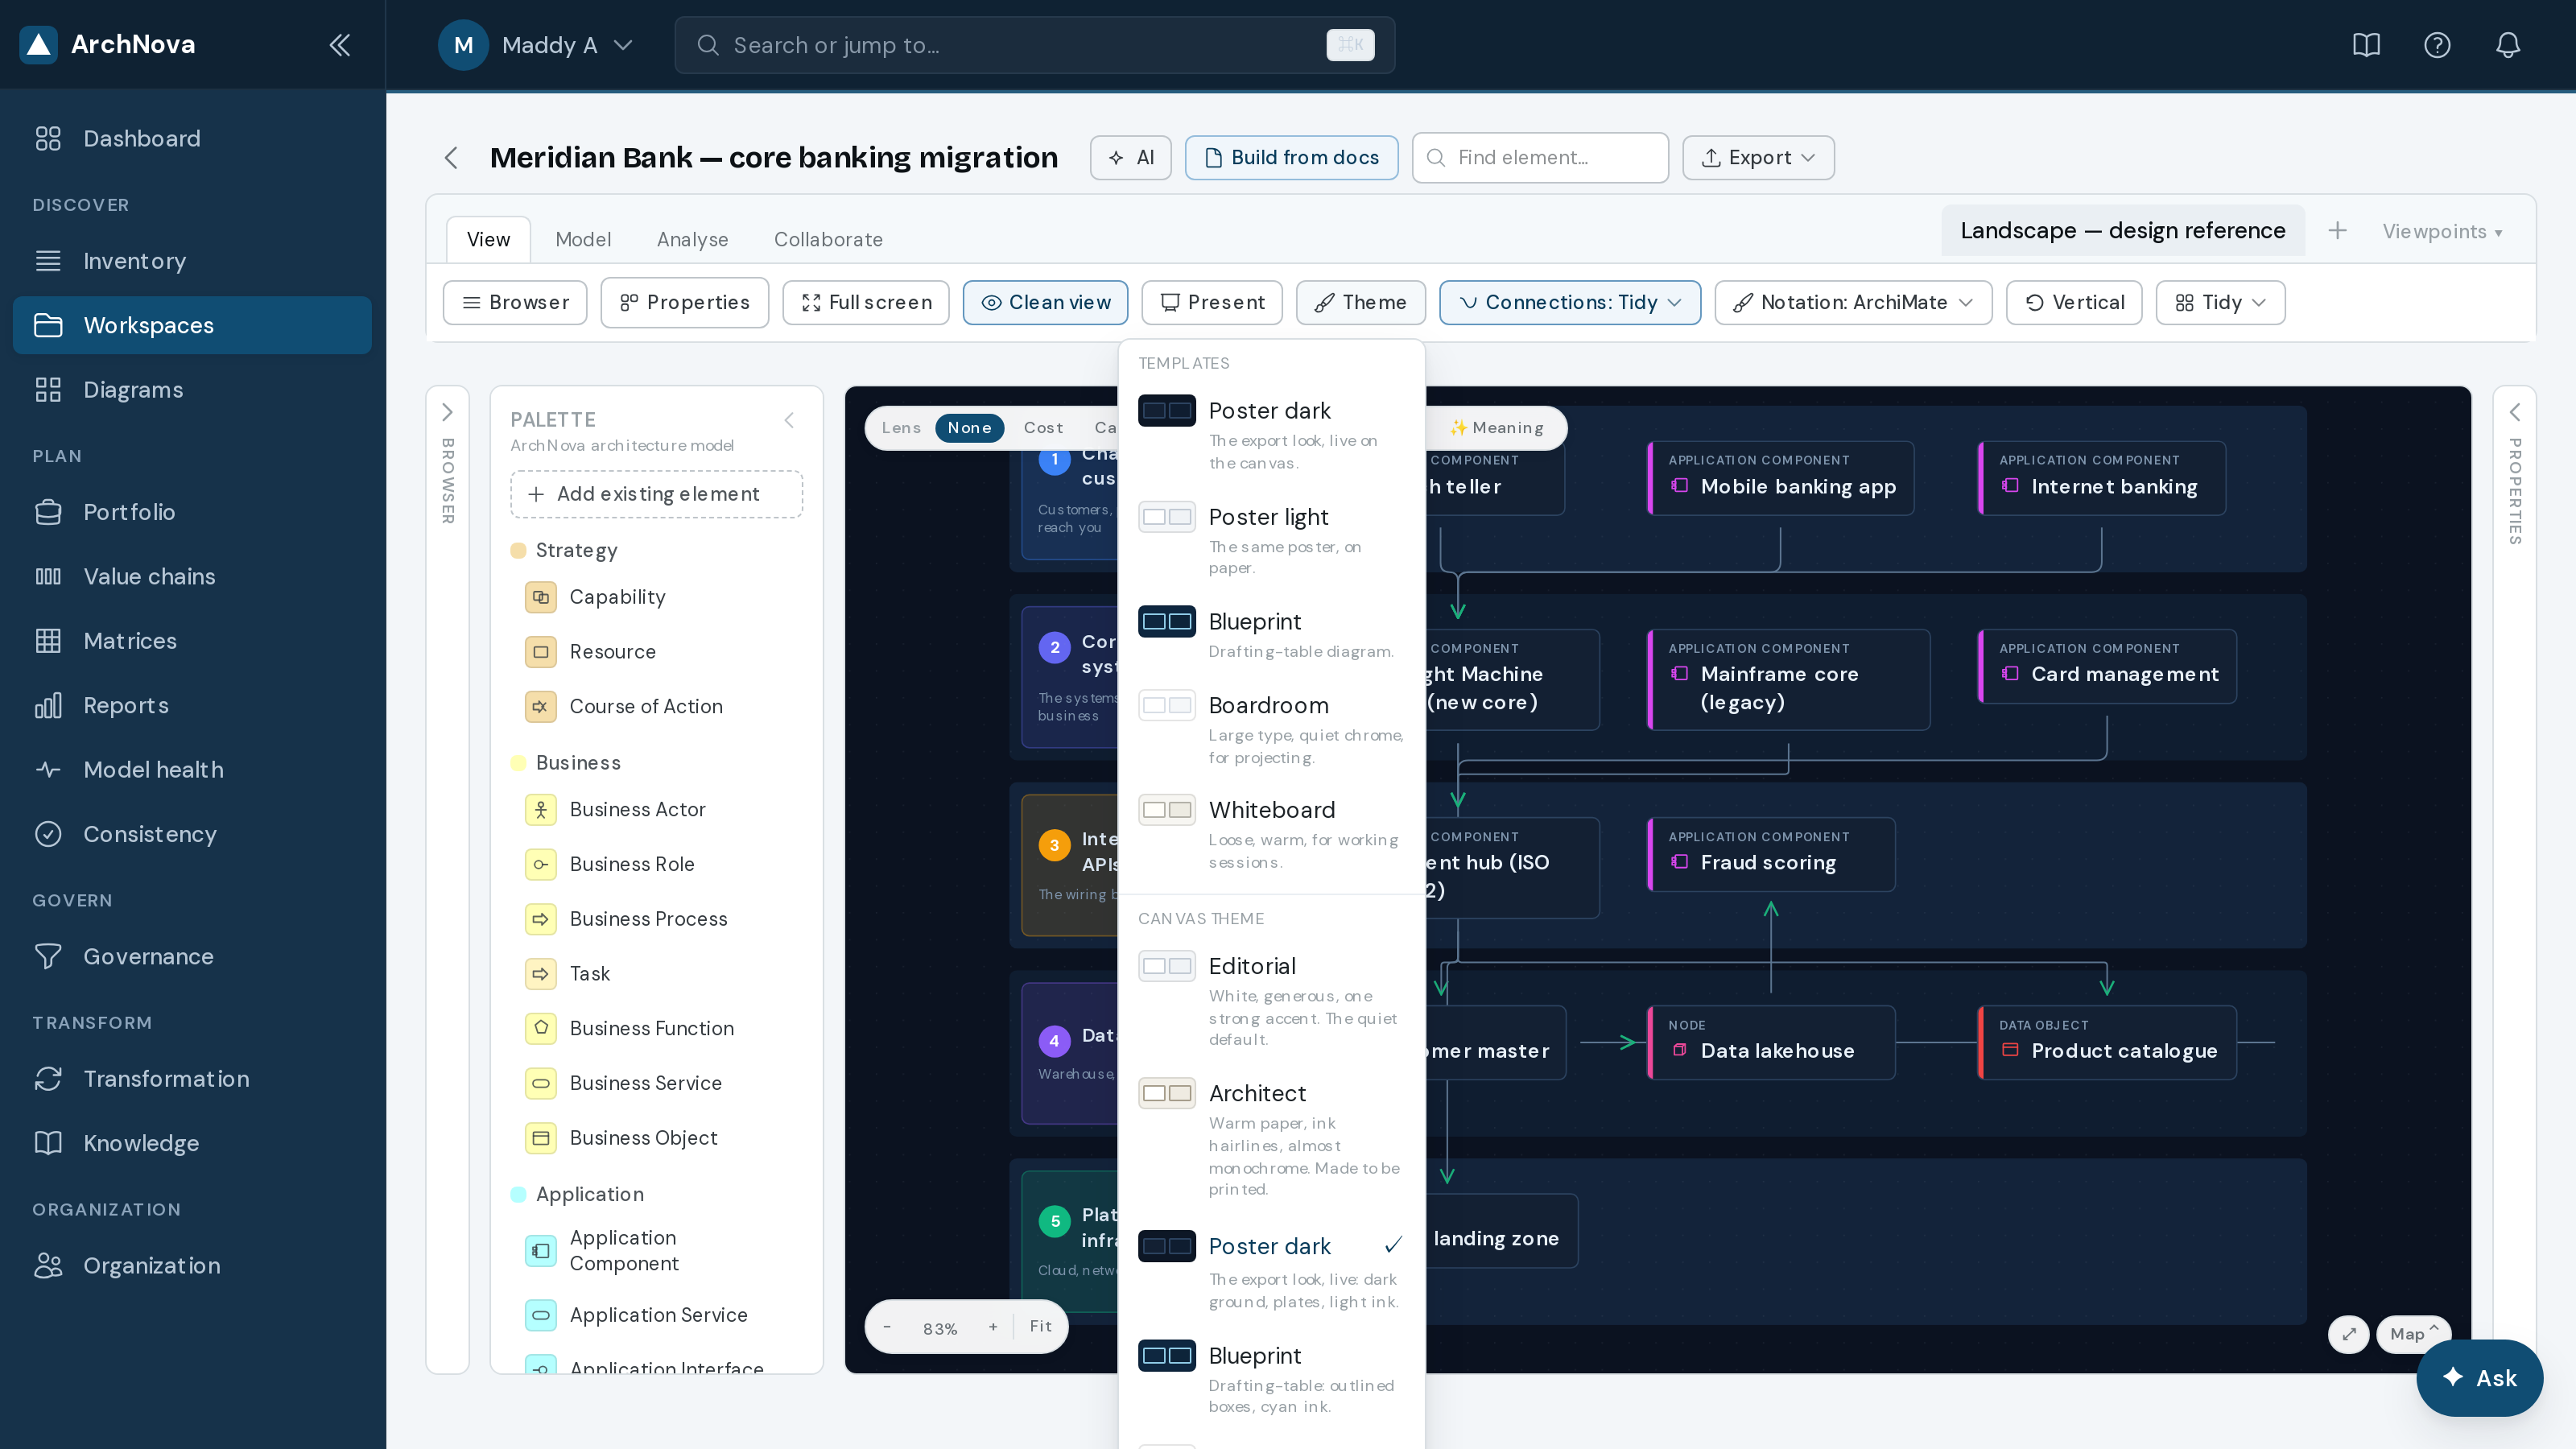
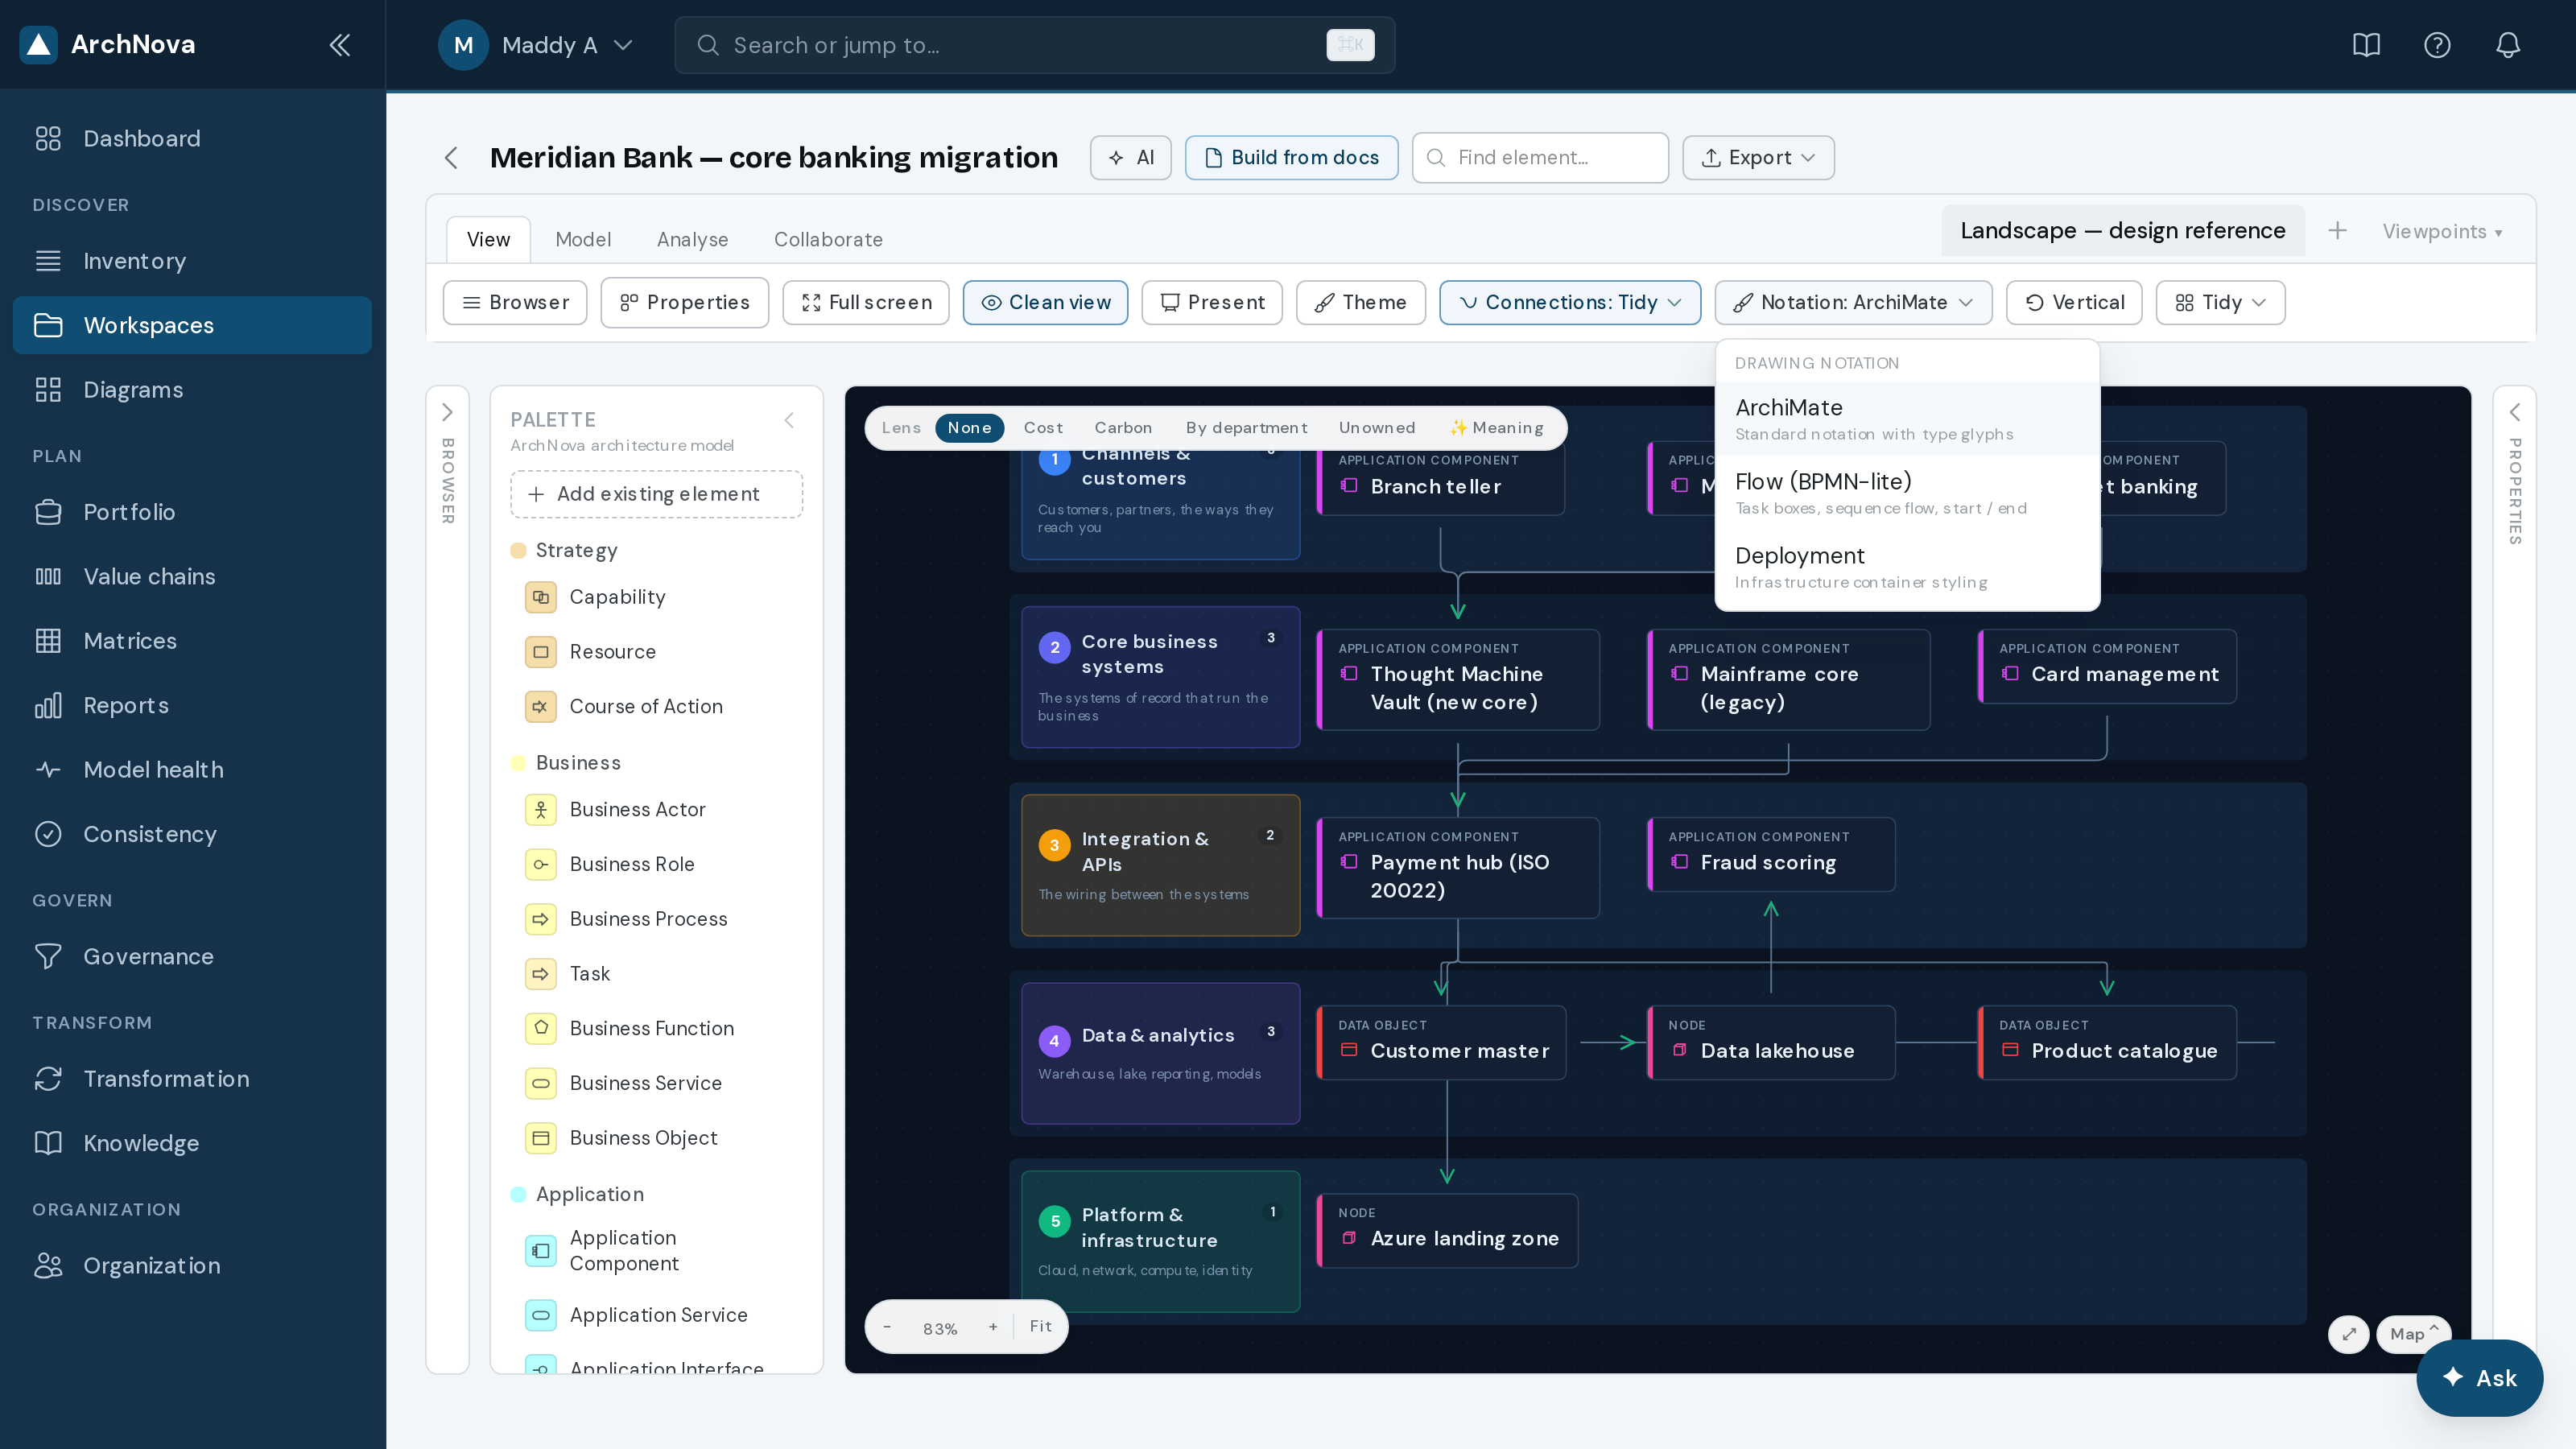
Model tools and collaboration
7Analysis lenses
A lens re-shades the landscape you are already looking at, so a question gets answered in place rather than in a separate report. The lens bar sits at the top of the canvas; Esc clears it.
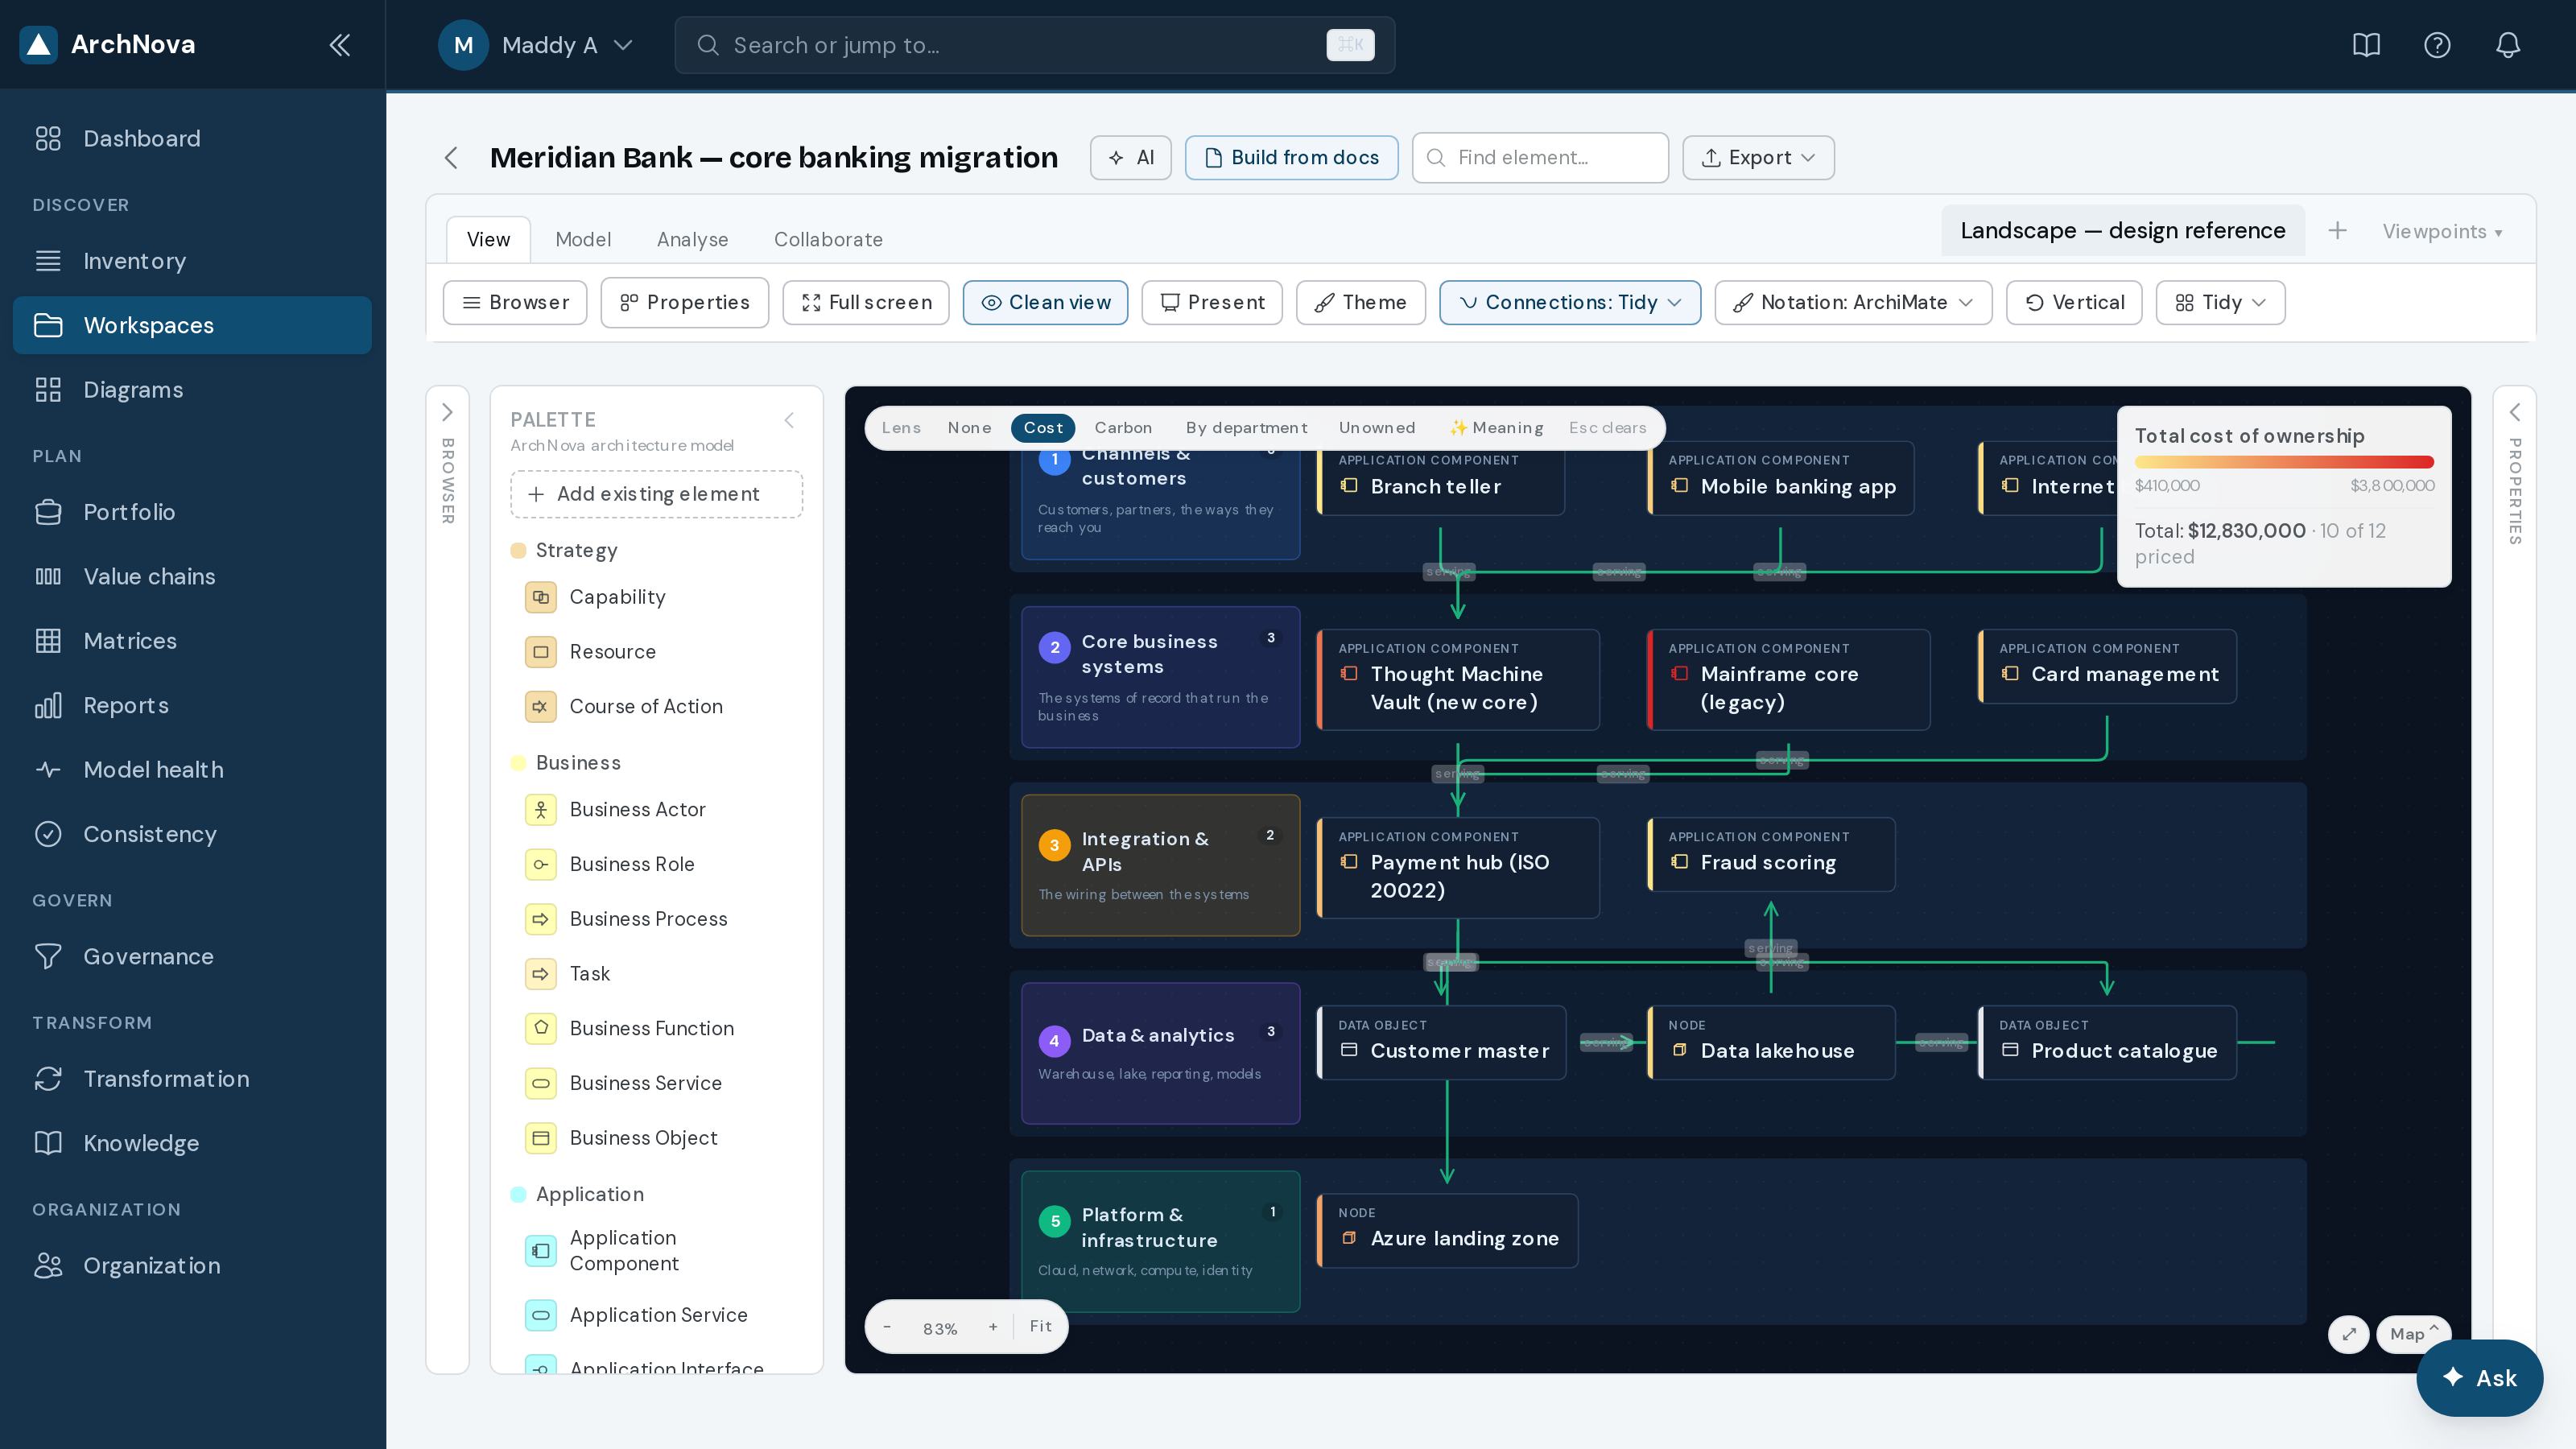
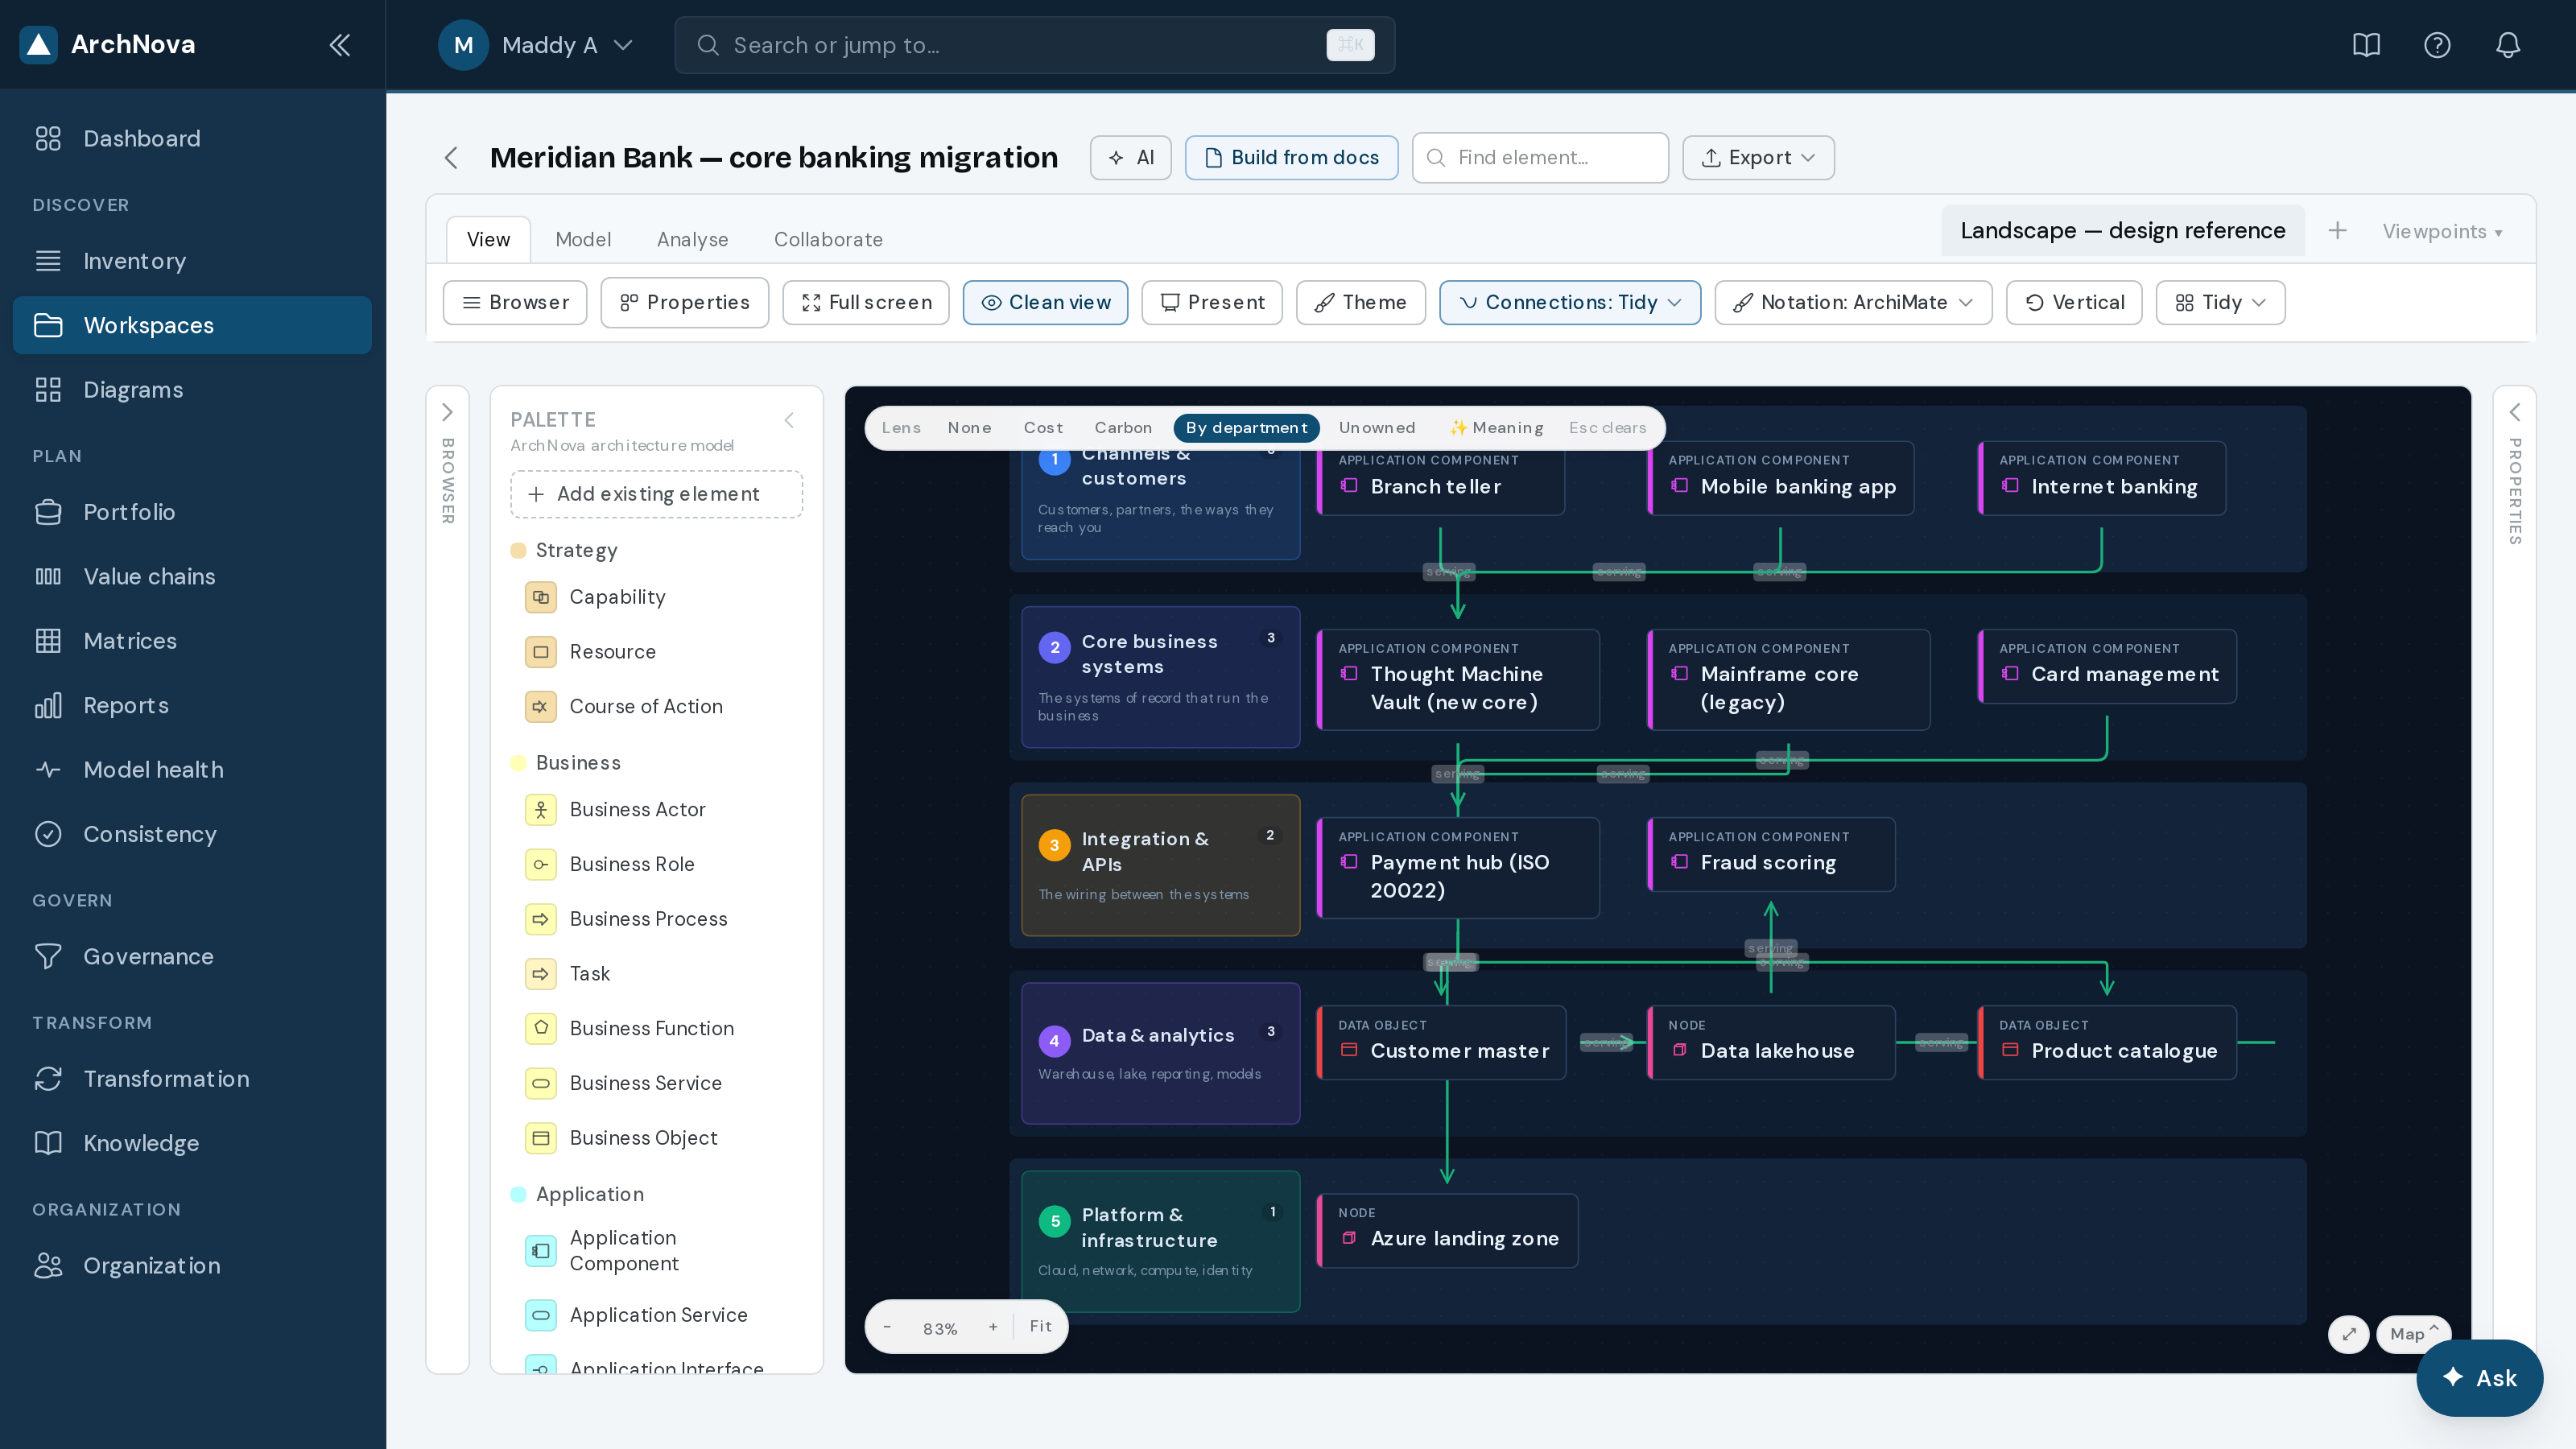
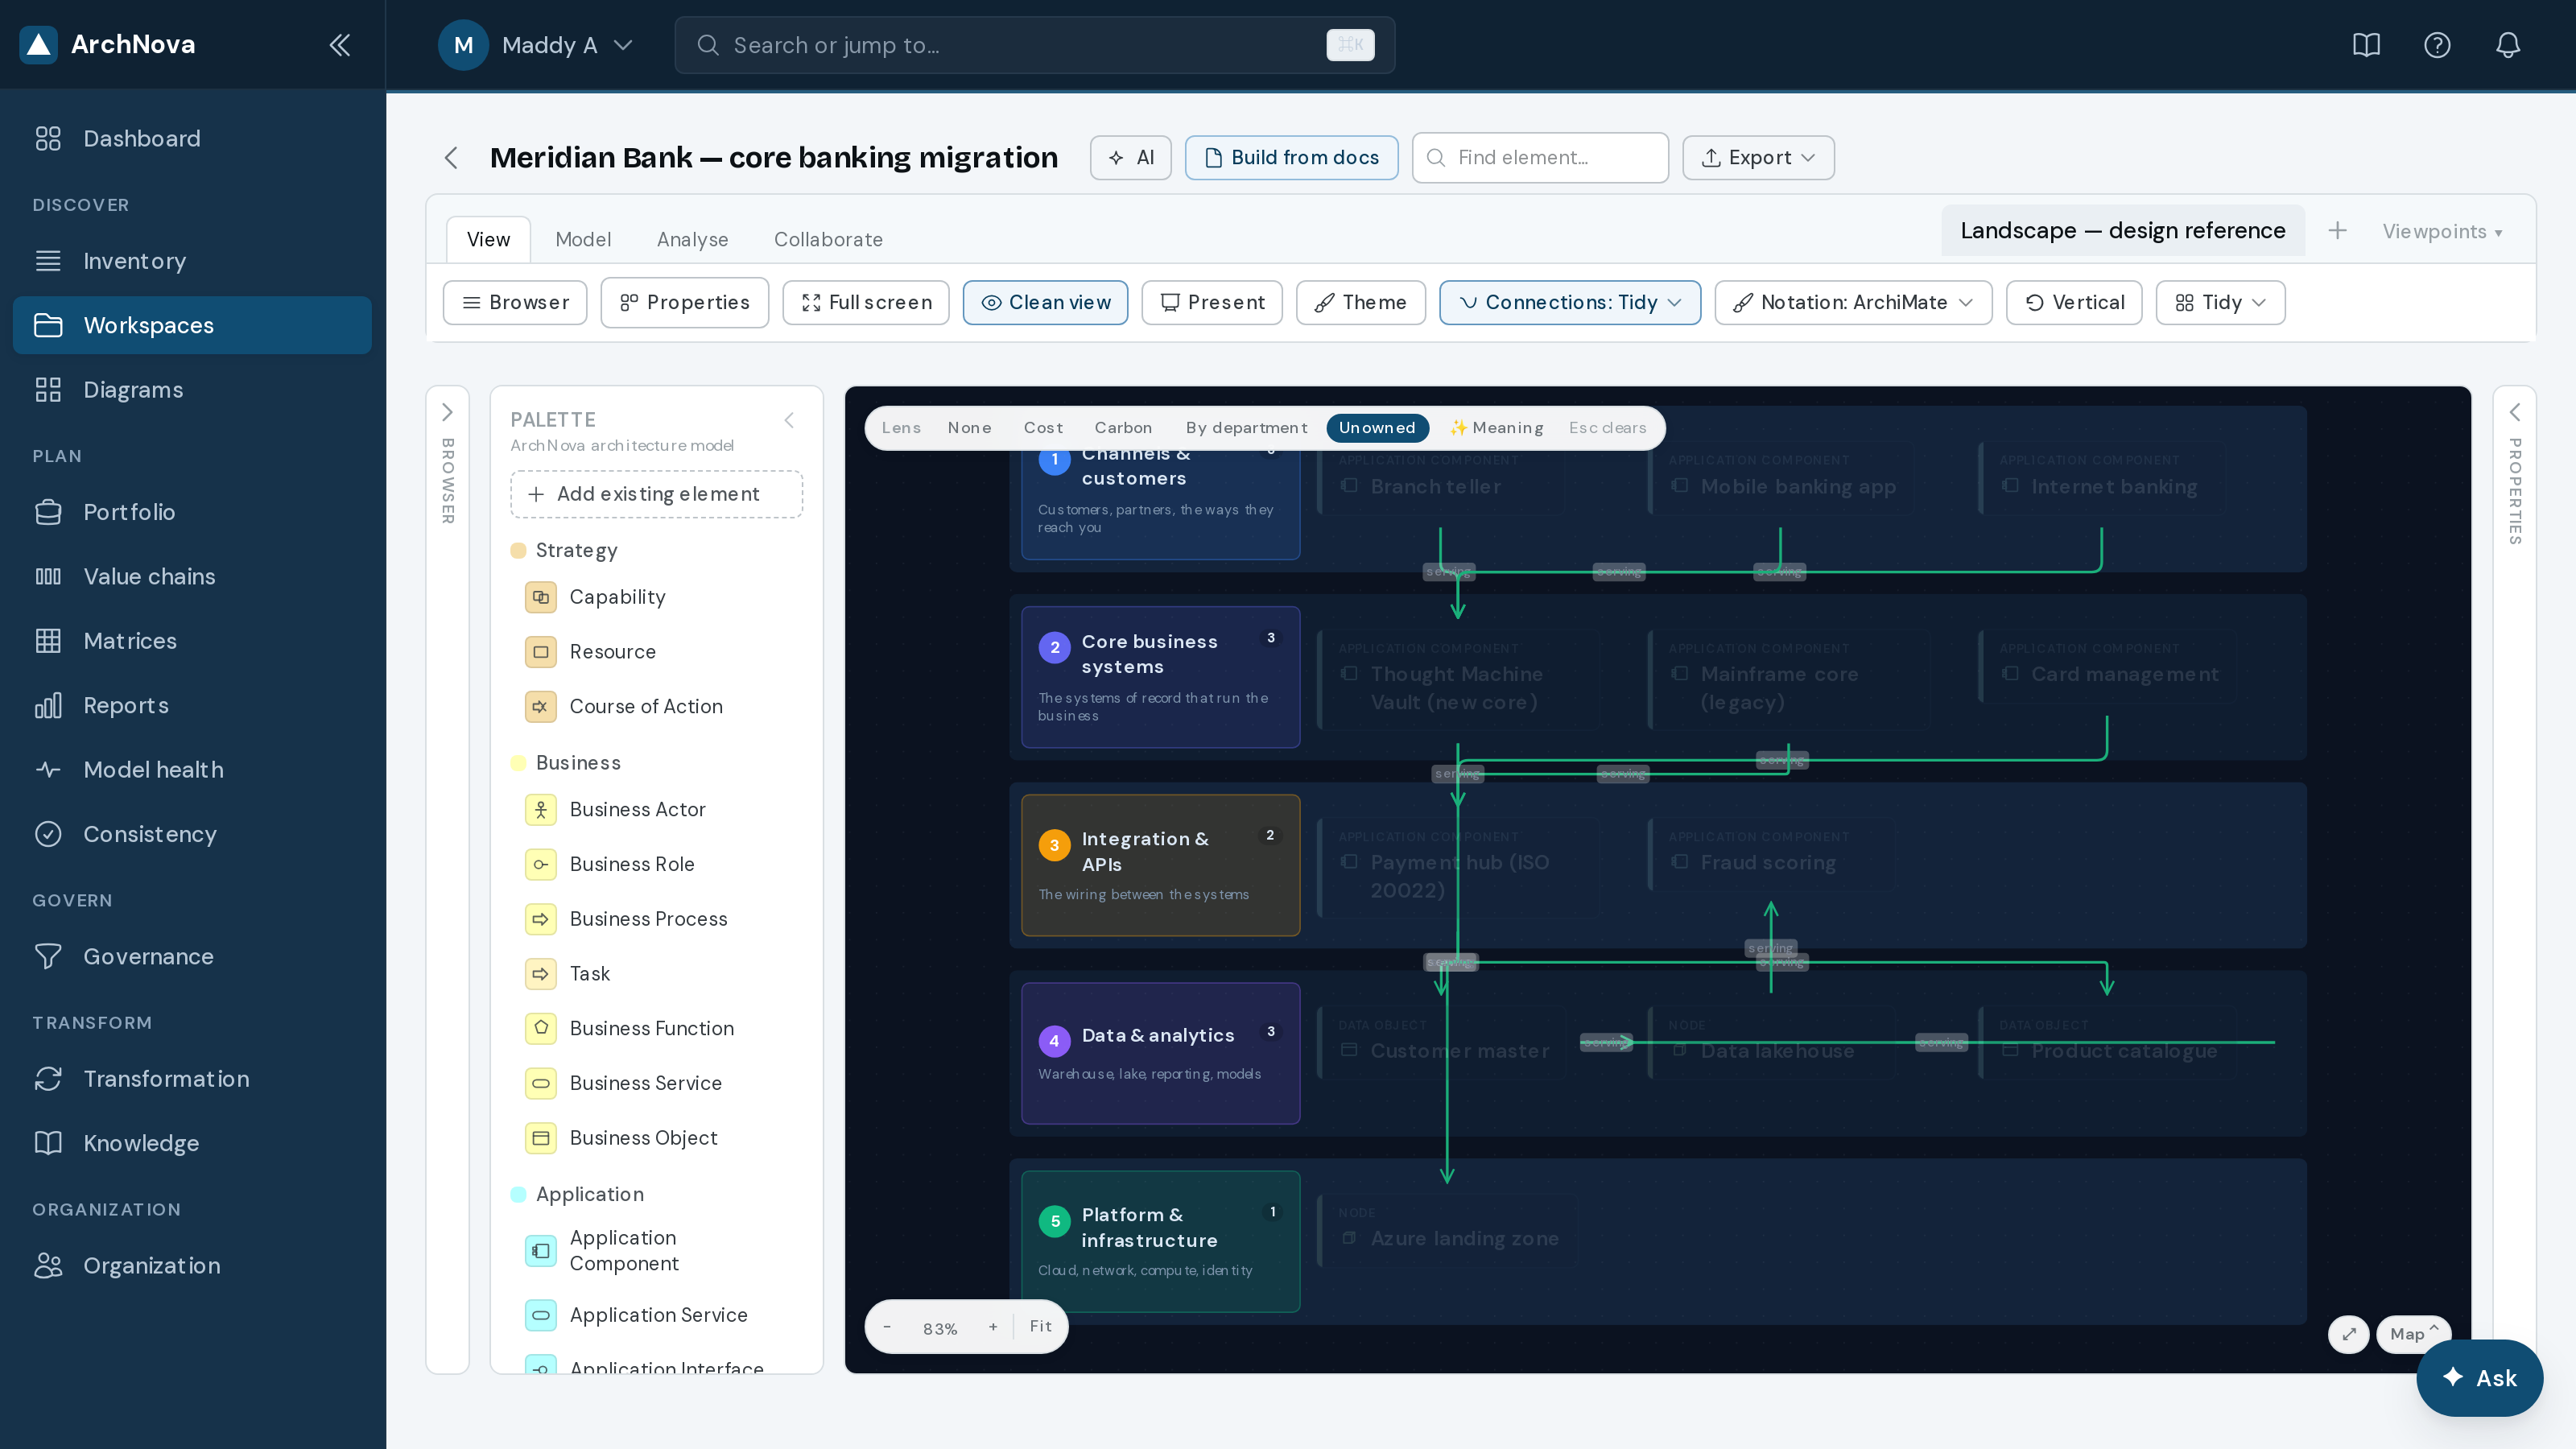
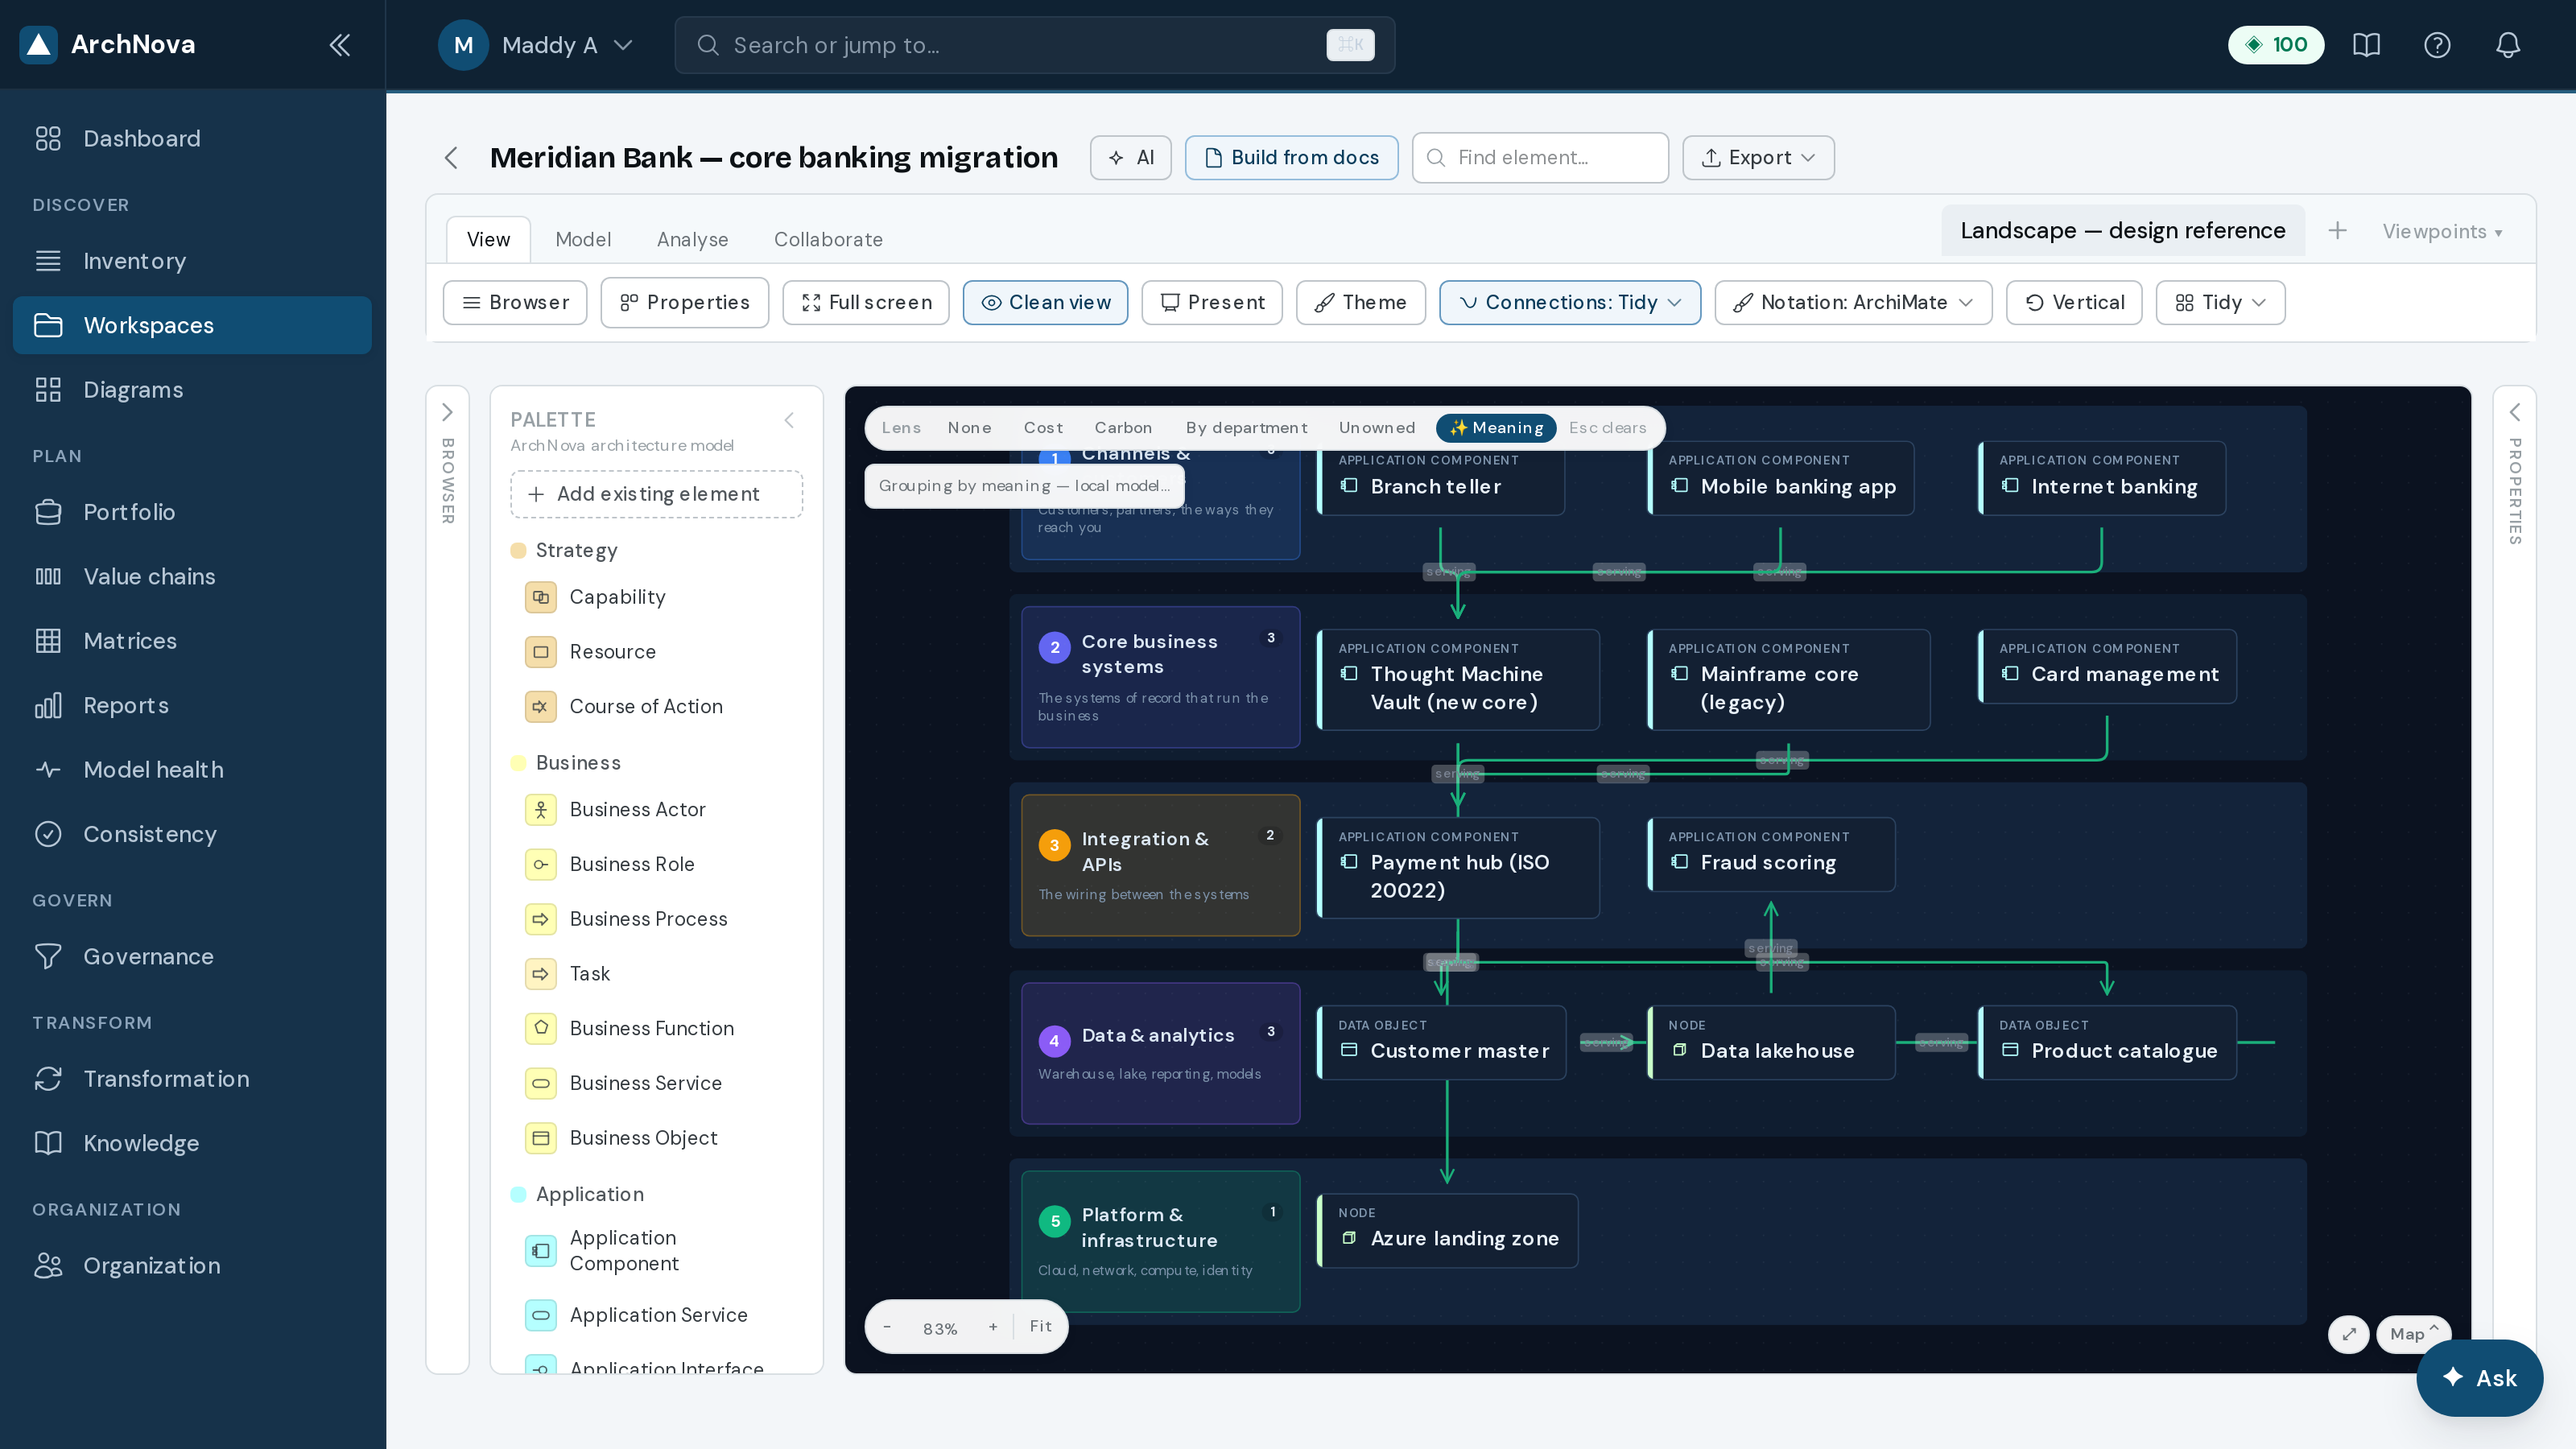
Carbon works like Cost, over estimated emissions. Meaning is the AI lens — it groups the landscape by what things are for rather than what layer they sit in.AI
8AI on the canvasAI
Two AI entry points sit on the canvas itself: build a model from documents, and ask questions about the model you have.
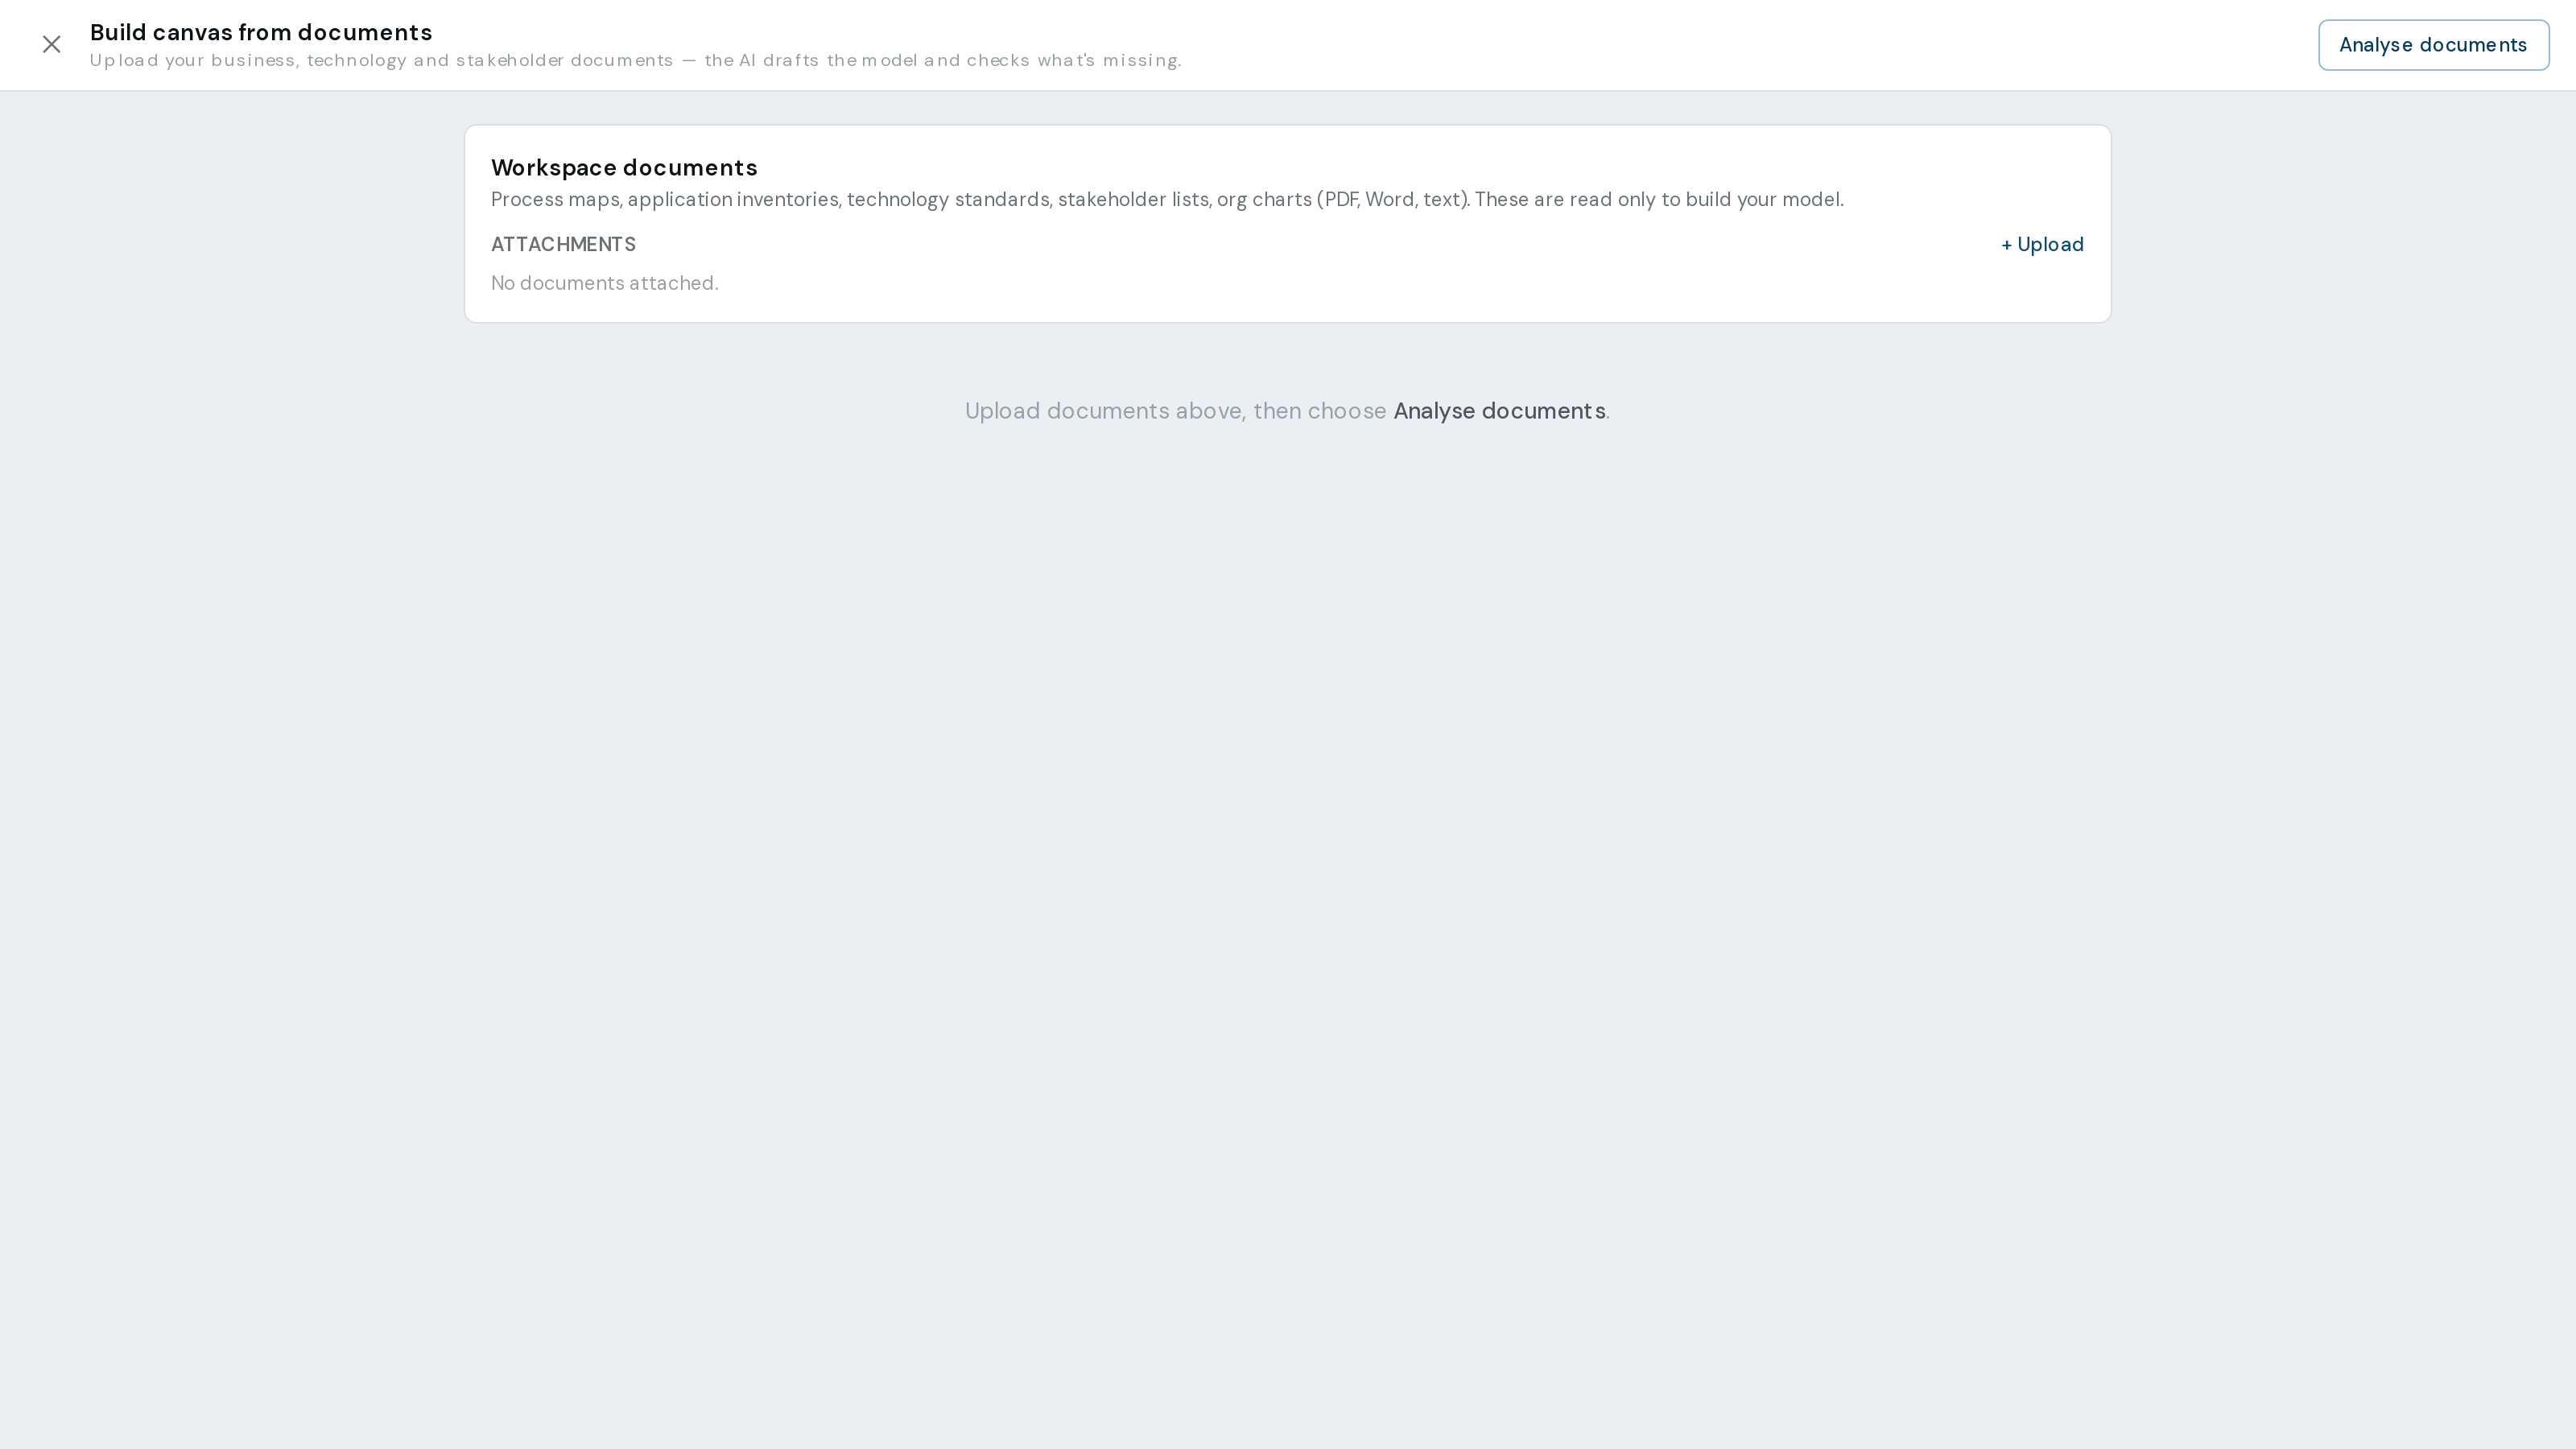
- Select Build from docs in the canvas header.
- Upload one or more documents and start the analysis.
- Review every proposed element before applying it. The draft is a starting point, not an answer — accept what is right, discard what is not.
9Diagrams
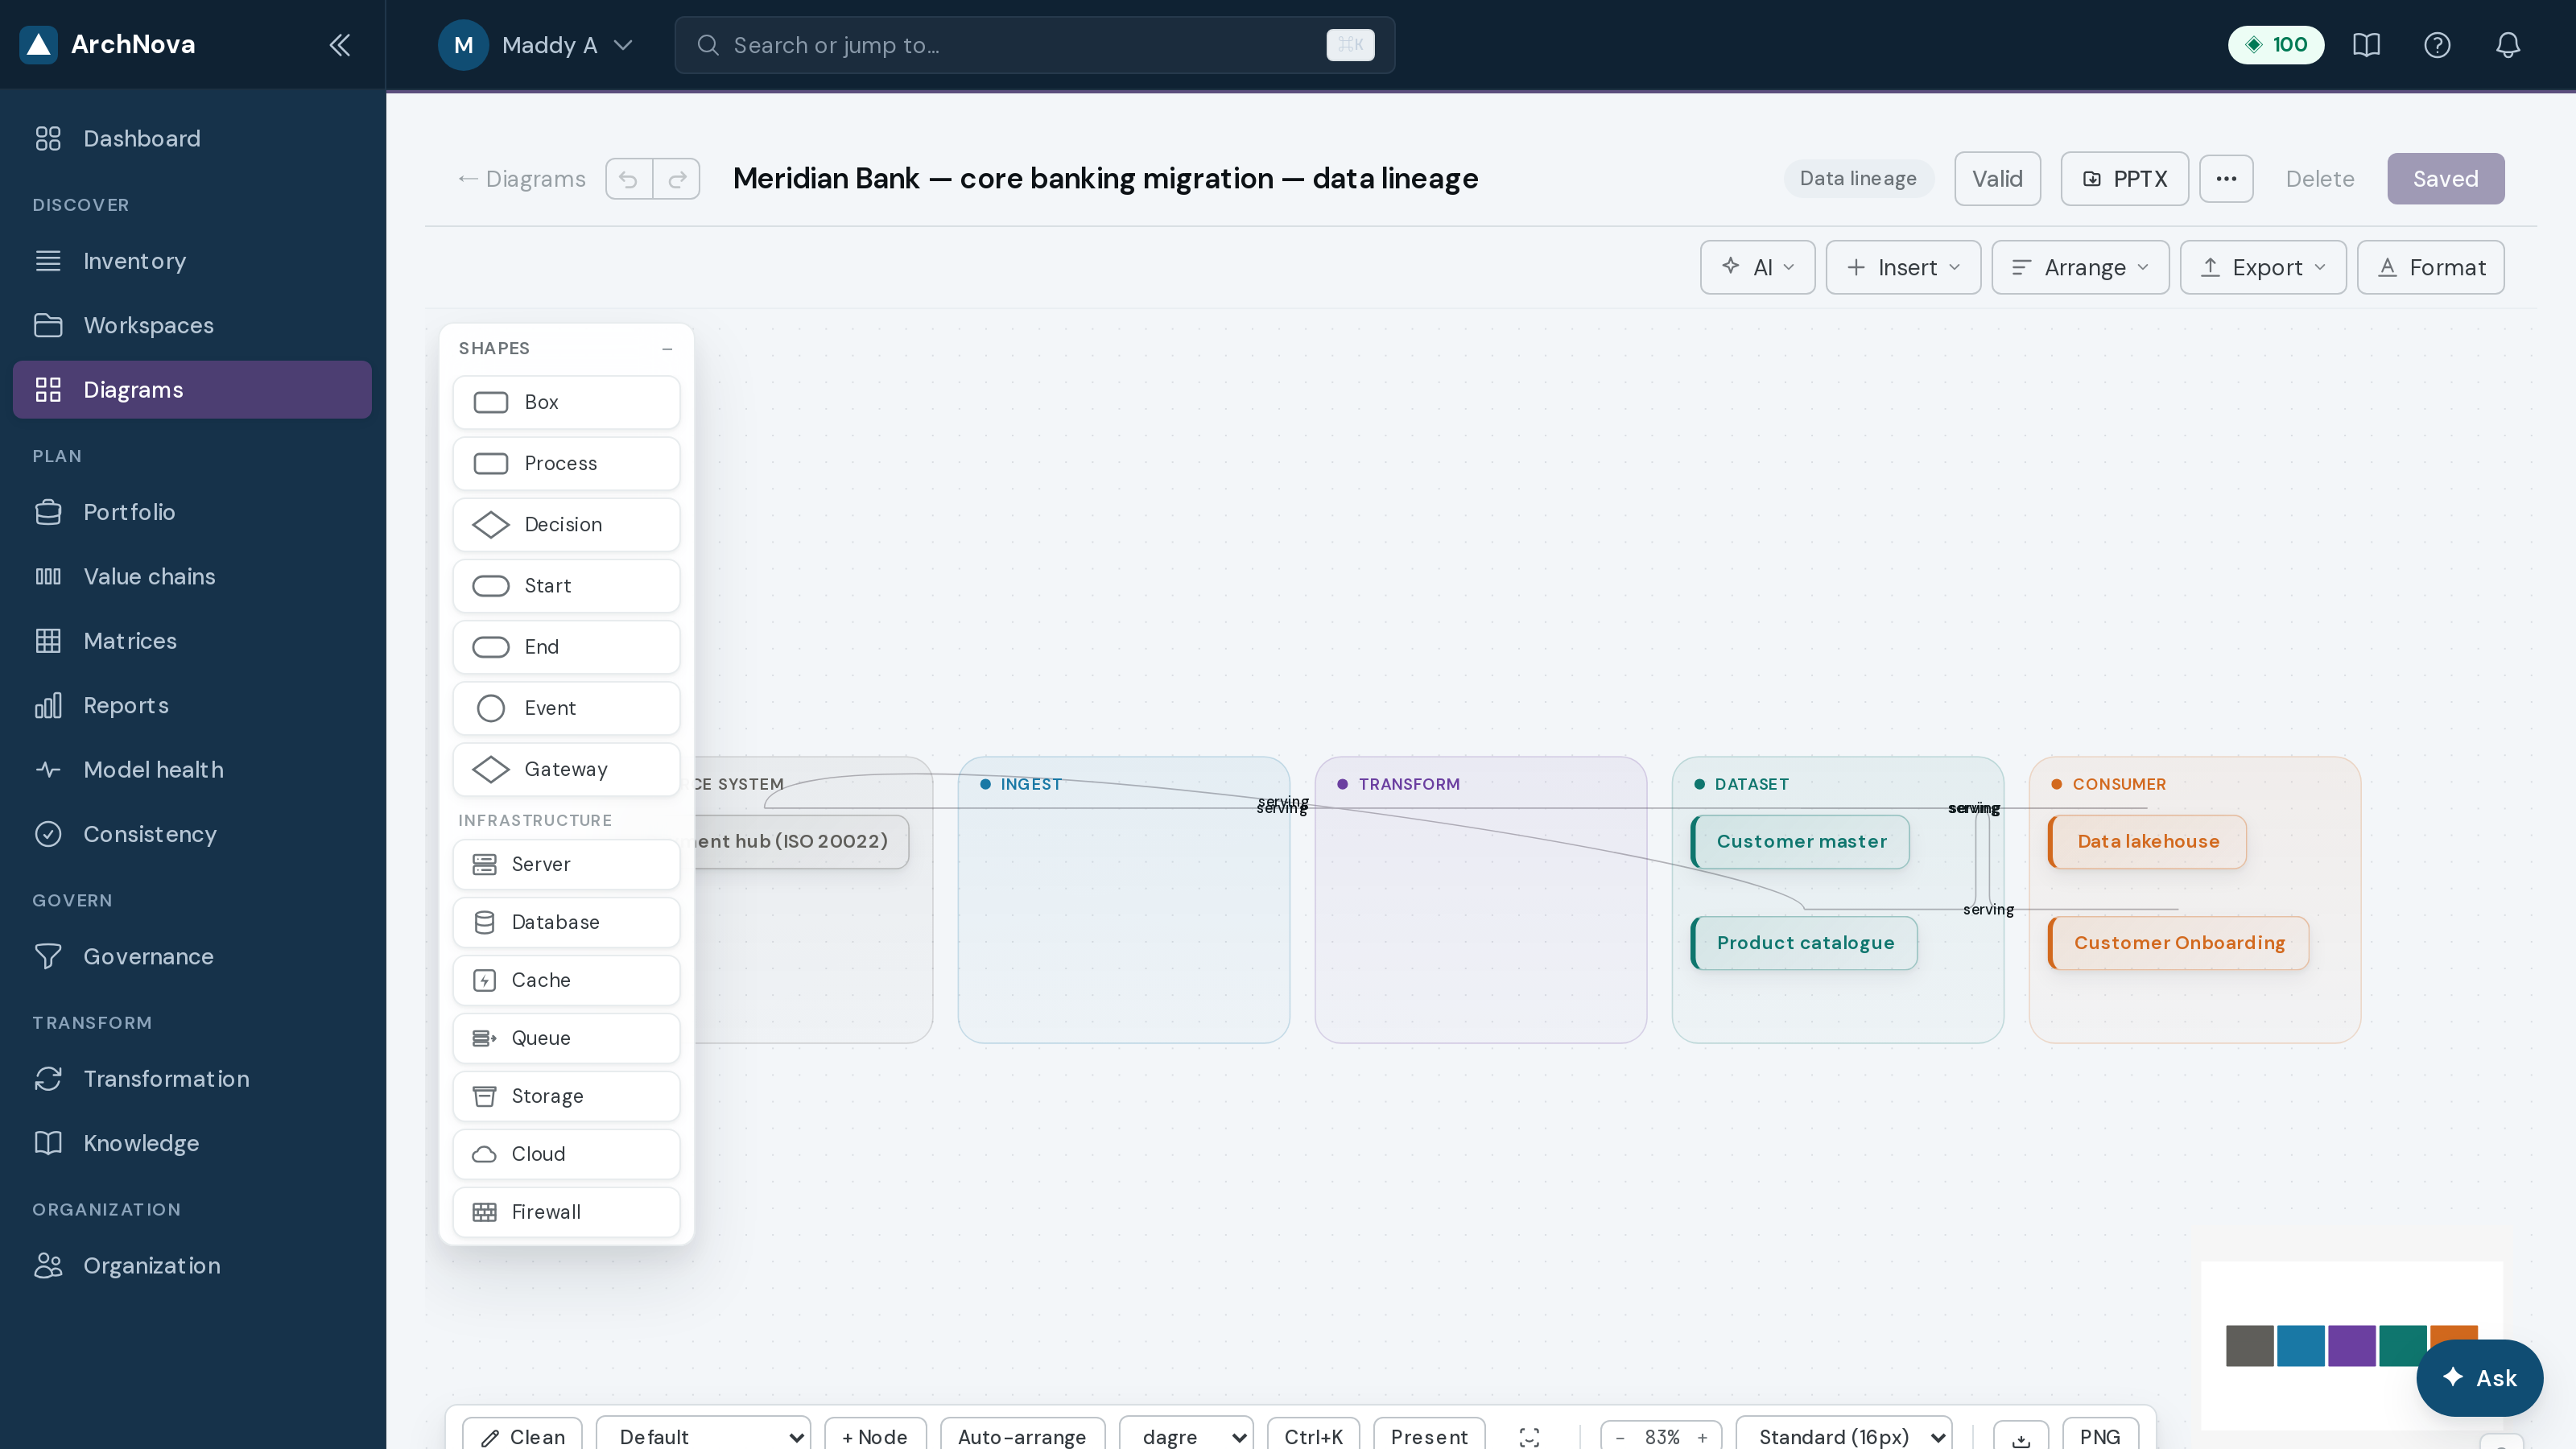
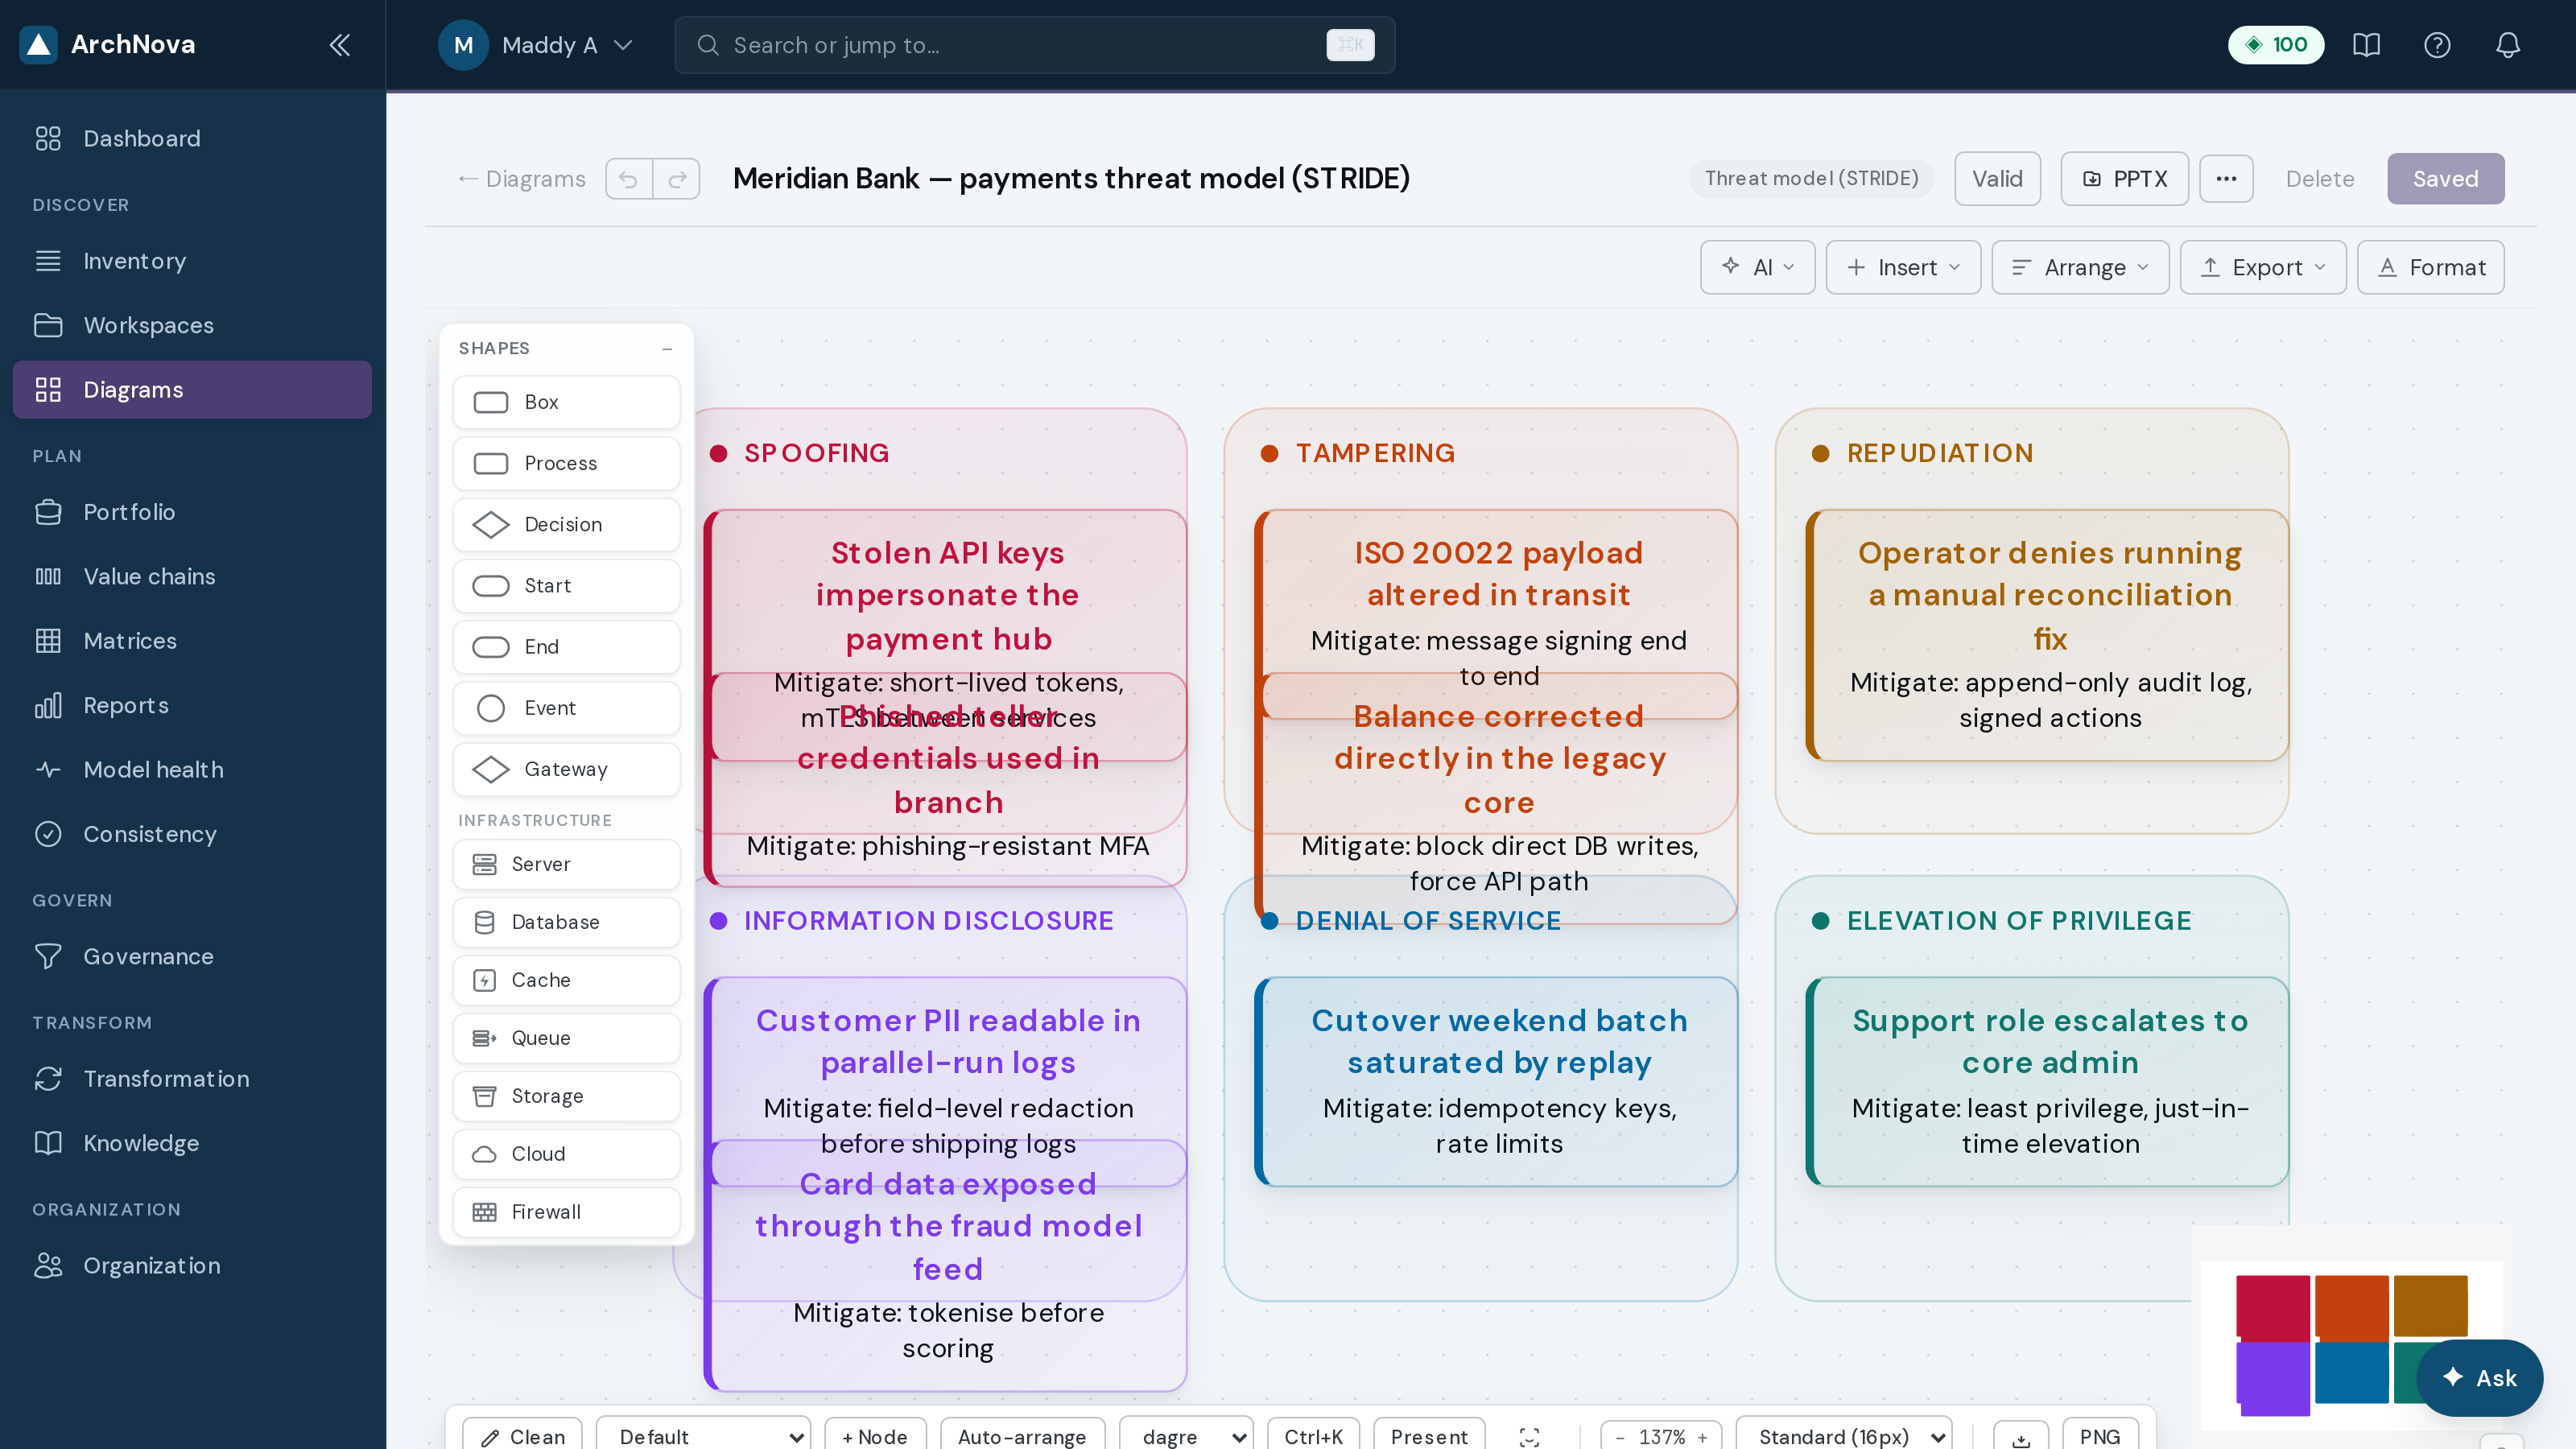
Diagrams covers everything that is not the architecture landscape: data flows, flowcharts, mind maps, customer journeys, SWOTs, business model canvases, org charts and more.
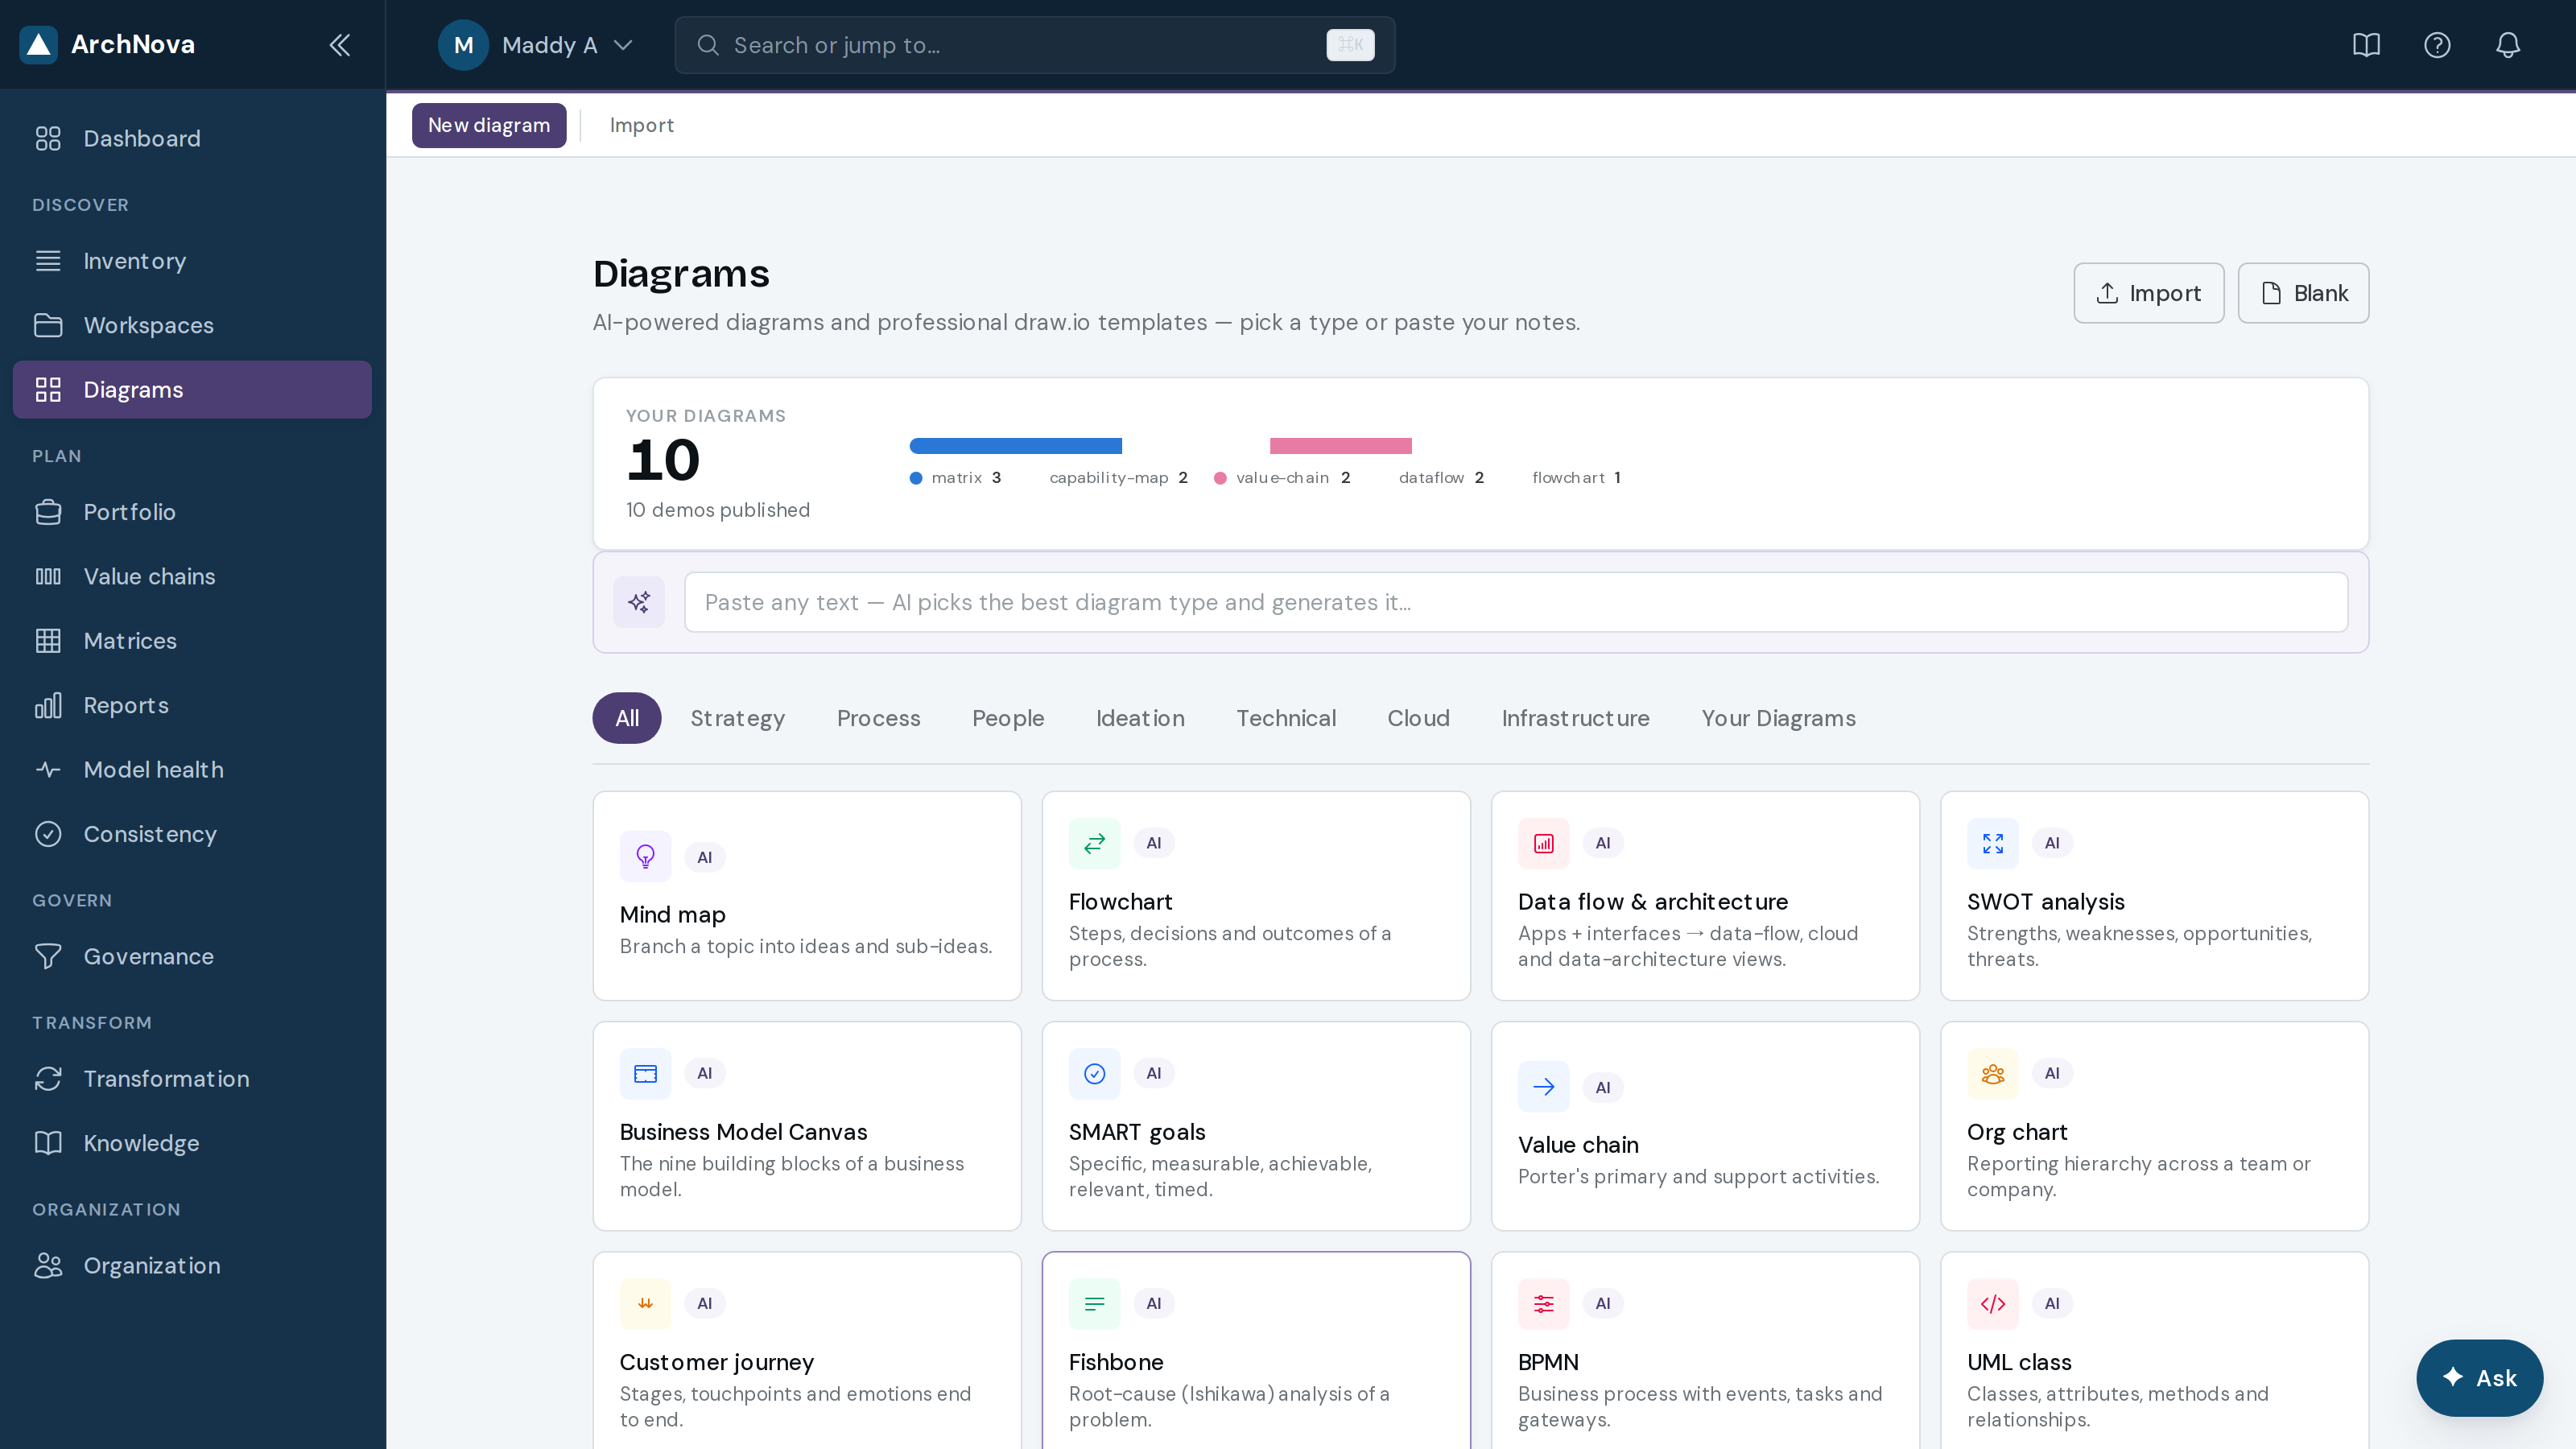
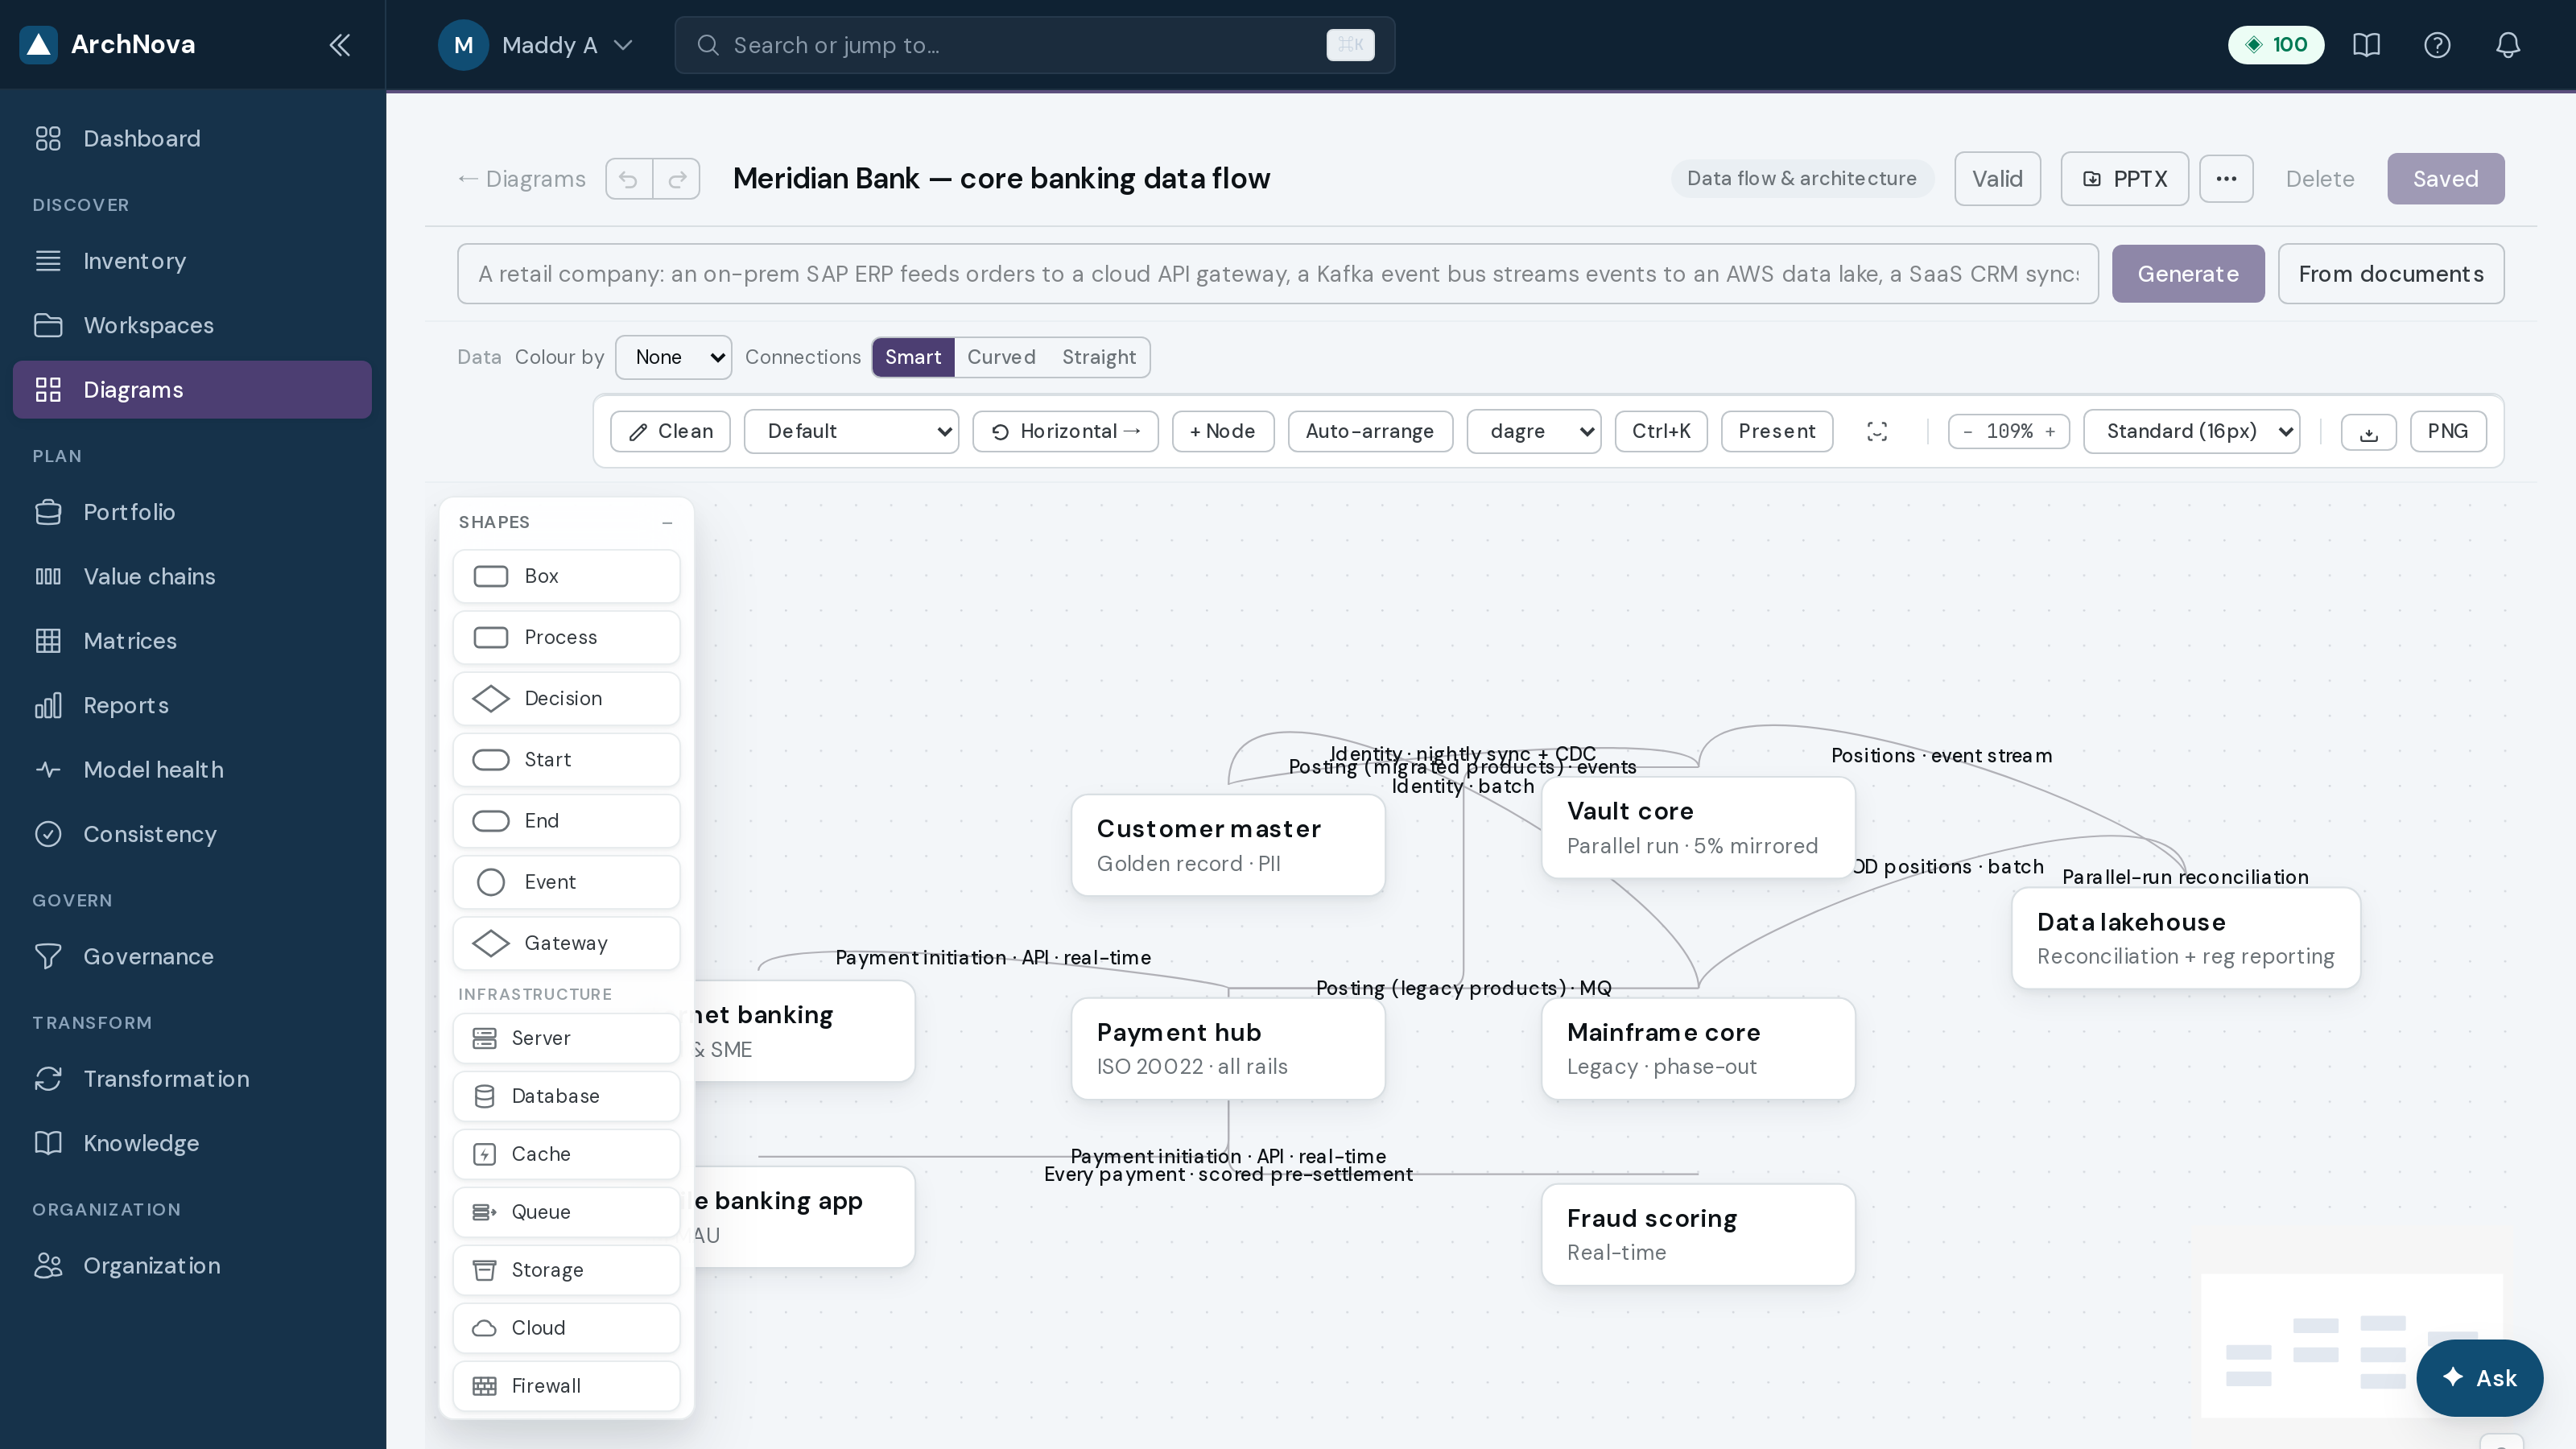
- Pick a diagram type, or describe what you want and select Generate.AI
- Edit directly: drag shapes from the palette, label edges, and use Auto-arrange to lay it out.
- Colour by shades nodes by a property; Connections switches routing.
- Export to PPTX or PNG, or use From documents to derive the diagram from a source file.
Derived from the model
Two diagrams build themselves from what you have already modelled, so they cannot drift from it:
Deciding what to do about it
With the estate in the model, Plan is where you find the waste, the risk and the gaps — and produce something a board will read.
10Drawing editor
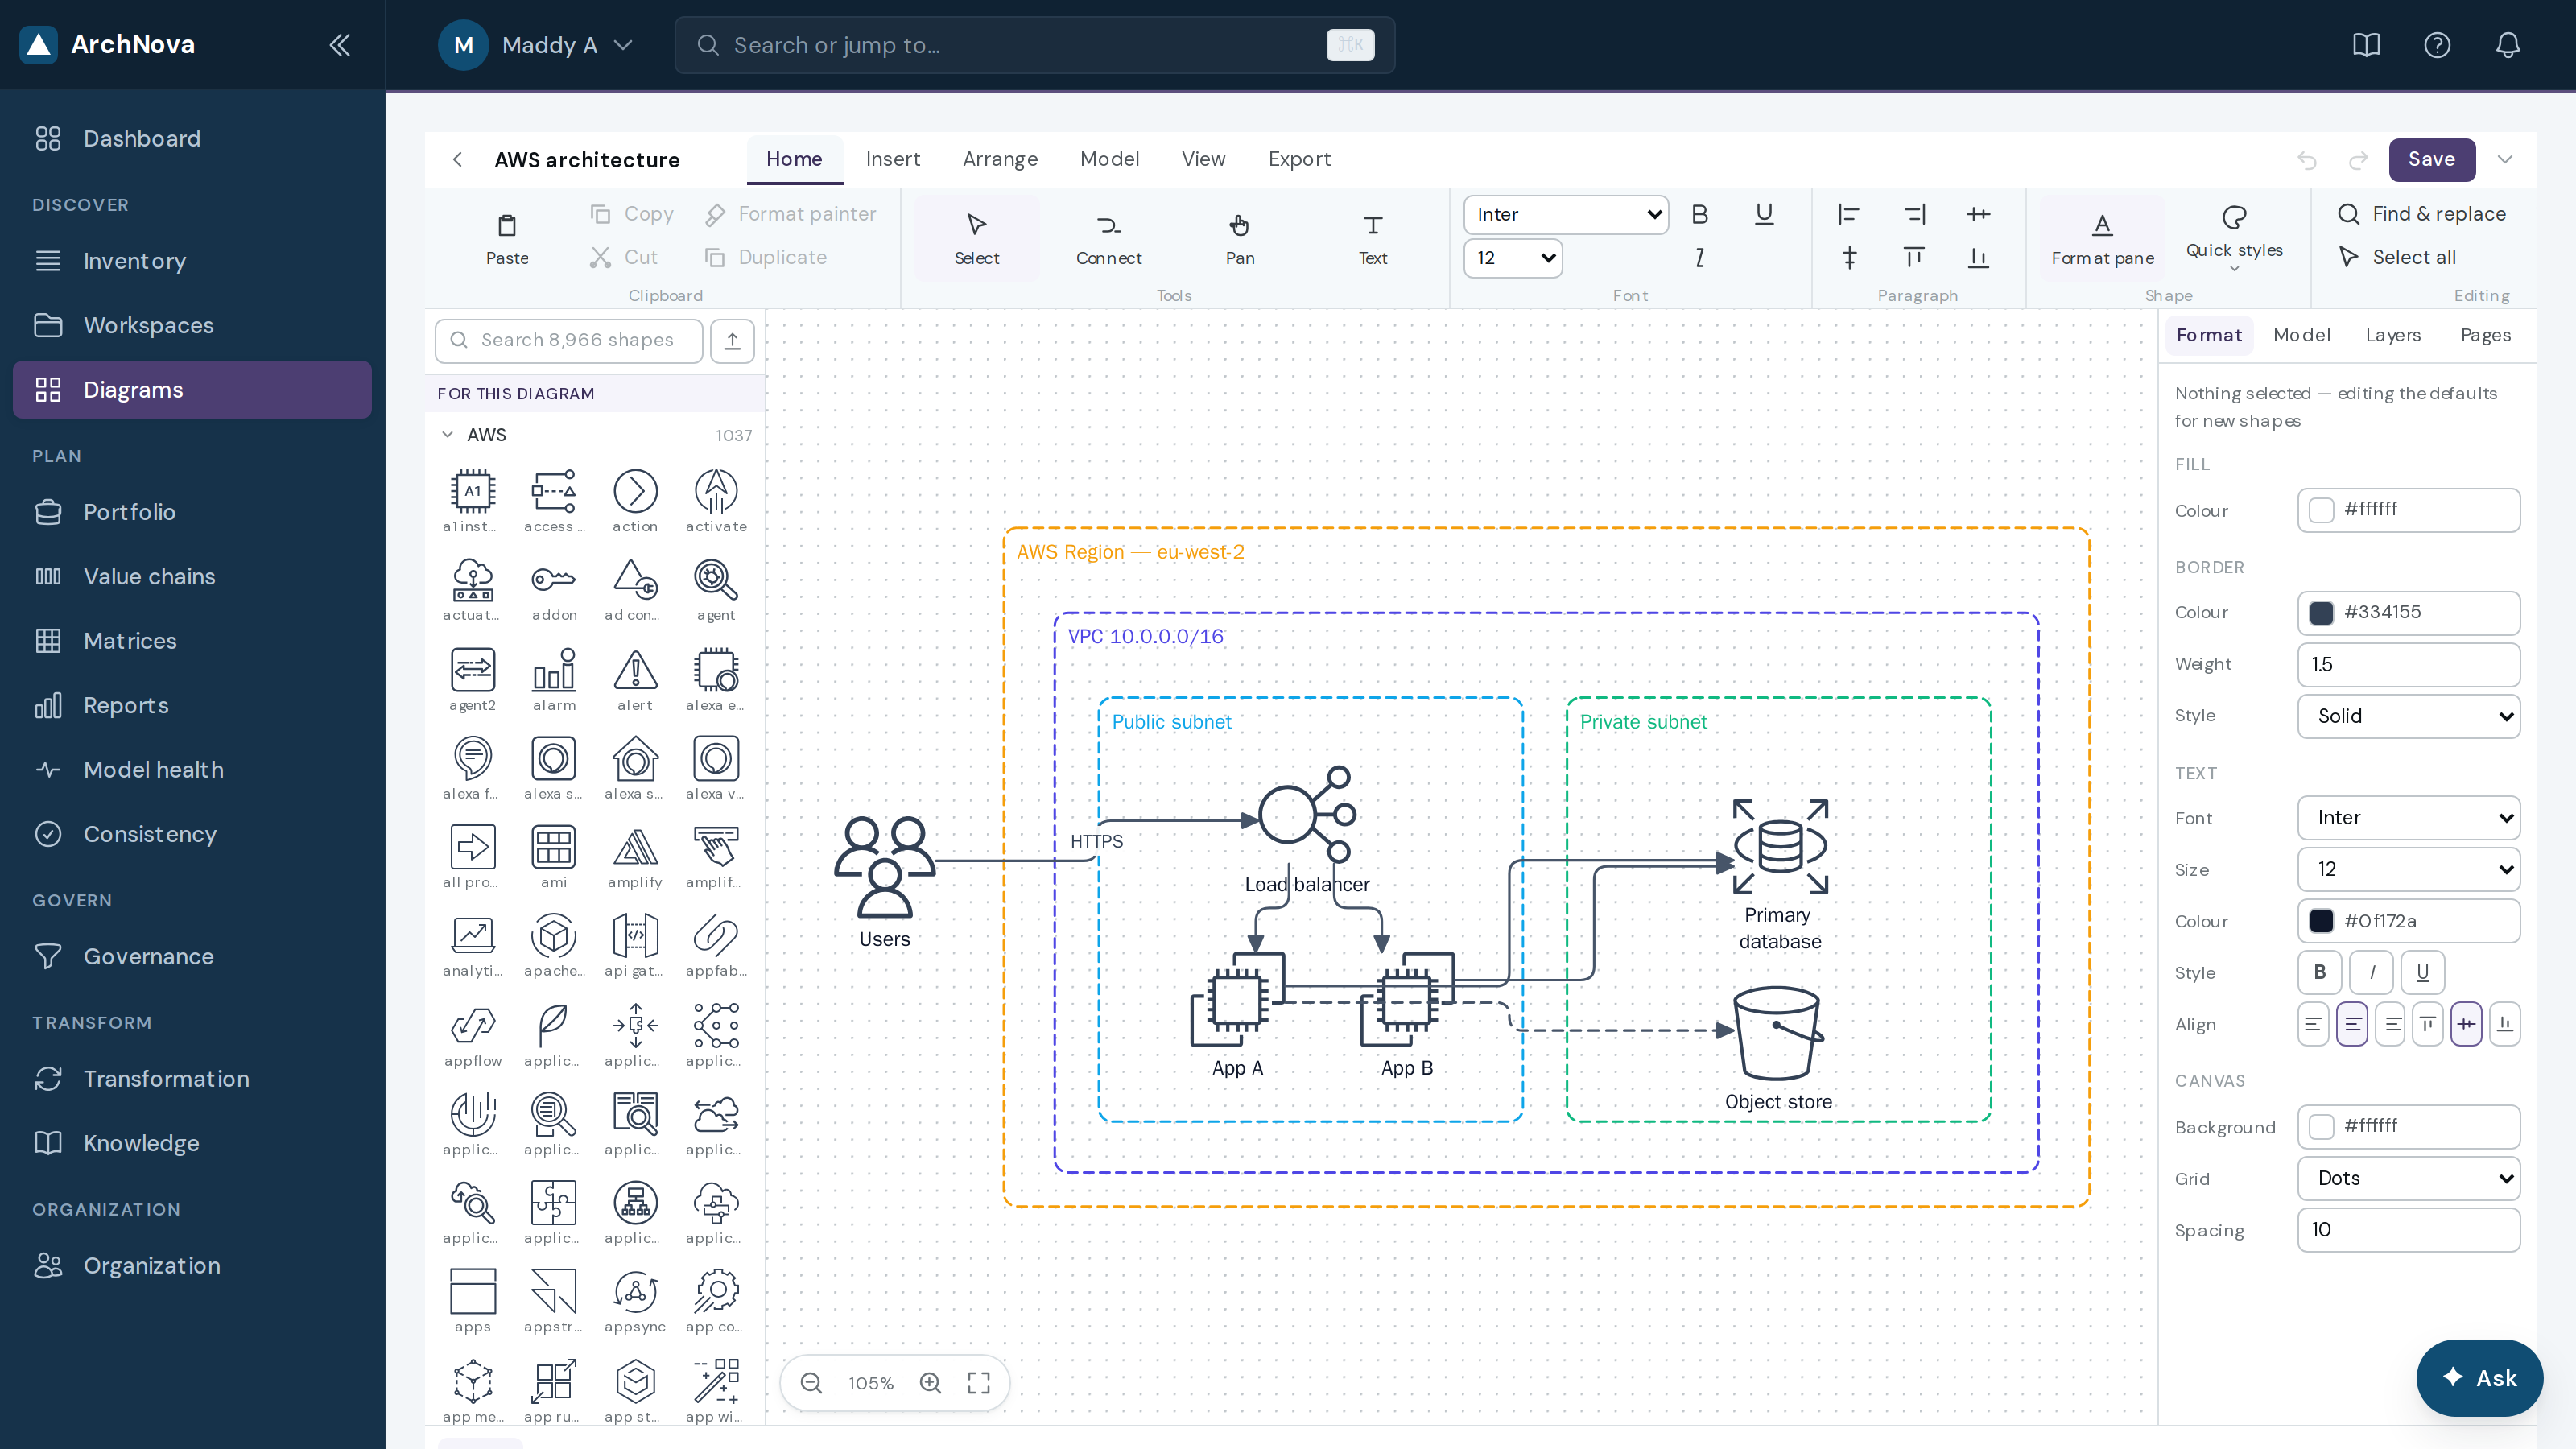
Some diagrams are generated; others are drawn. Cloud architectures, network topologies, racks and floor plans are drawn — freely, over 8,966 shapes in 49 packs, in an editor laid out like PowerPoint.
What is in it
| Feature | What it means |
|---|---|
| 8,966 shapes | 49 packs — AWS, Azure, Google Cloud, Kubernetes, Cisco, network, rack, BPMN, UML, office, floor plan and more. Searchable by name; a pack loads the first time you open it. |
| Free placement | Move, resize, rotate. Shapes snap to the grid and to each other, with guides showing what they aligned to. |
| Connection points | Hover a shape to reveal its ports; drag from one to another. Connectors re-route themselves as shapes move. |
| Waypoints | Double-click a connector to drop a bend exactly where you want it, and drag it afterwards. |
| Layers & containers | Hide or lock a layer while you work; a container takes whatever you drop into it and moves its contents with it. |
| Pages | Several drawings in one diagram. Each becomes its own slide on export. |
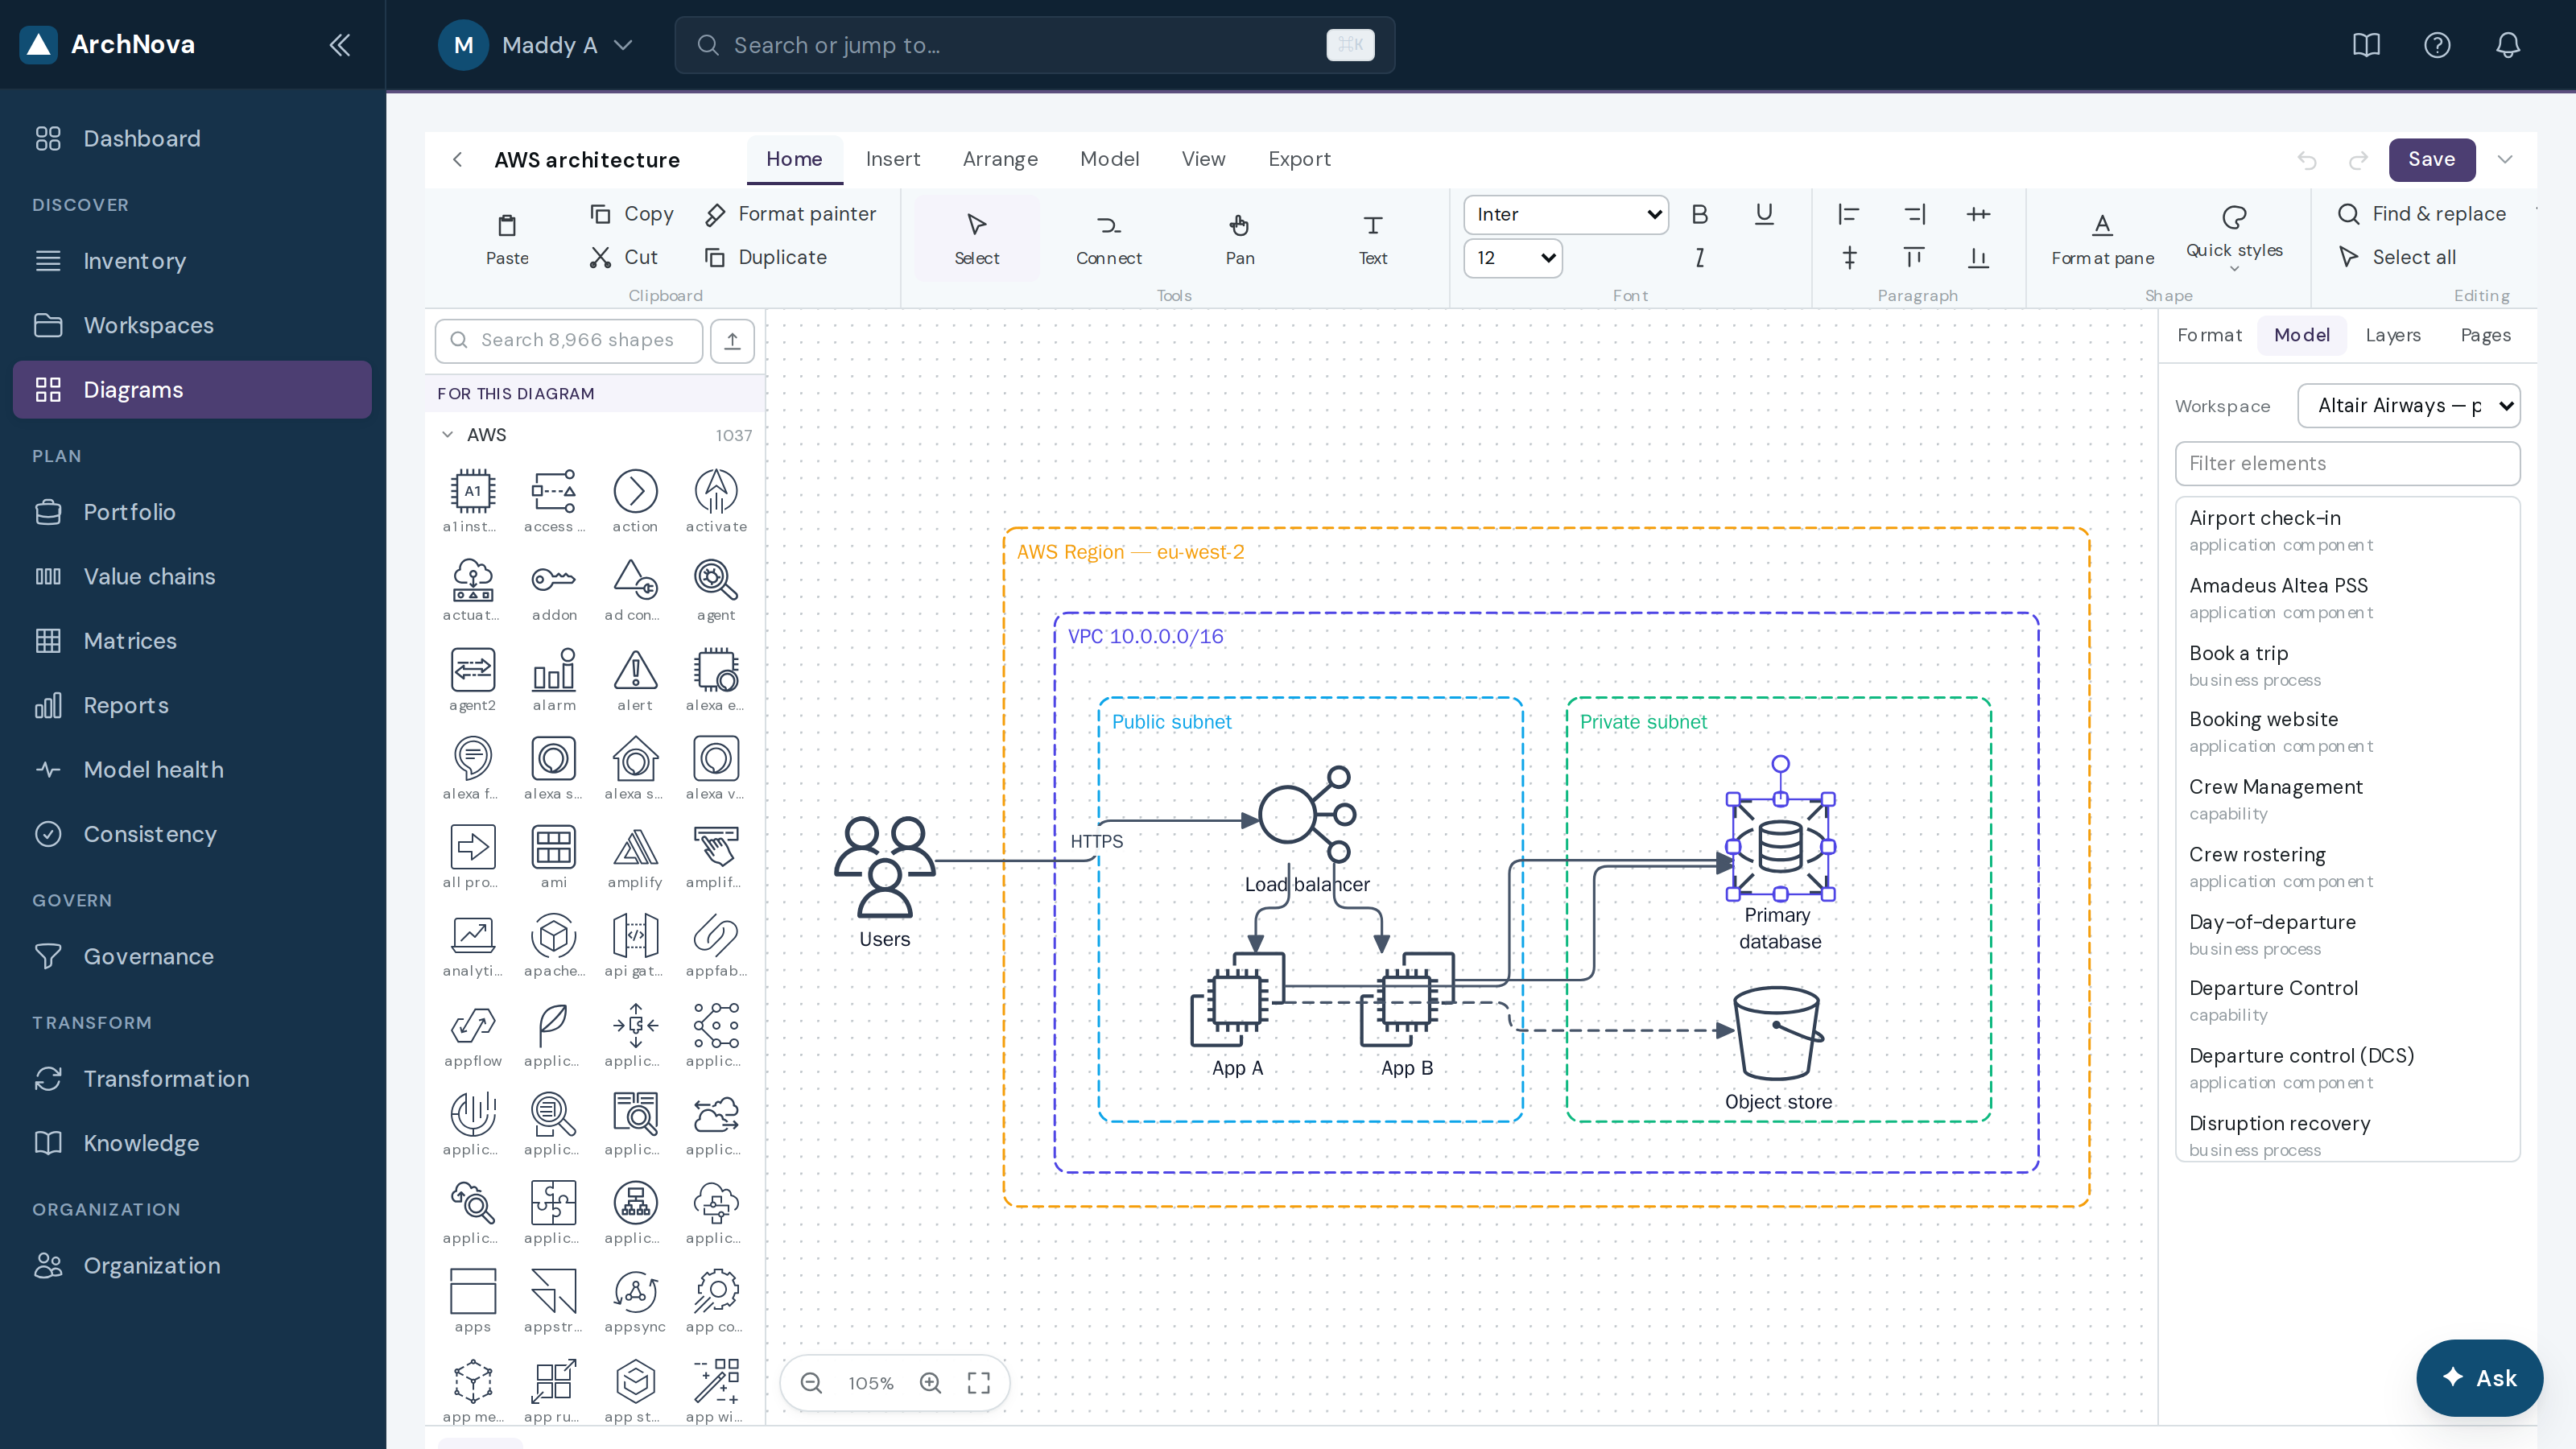
A shape can be a real element
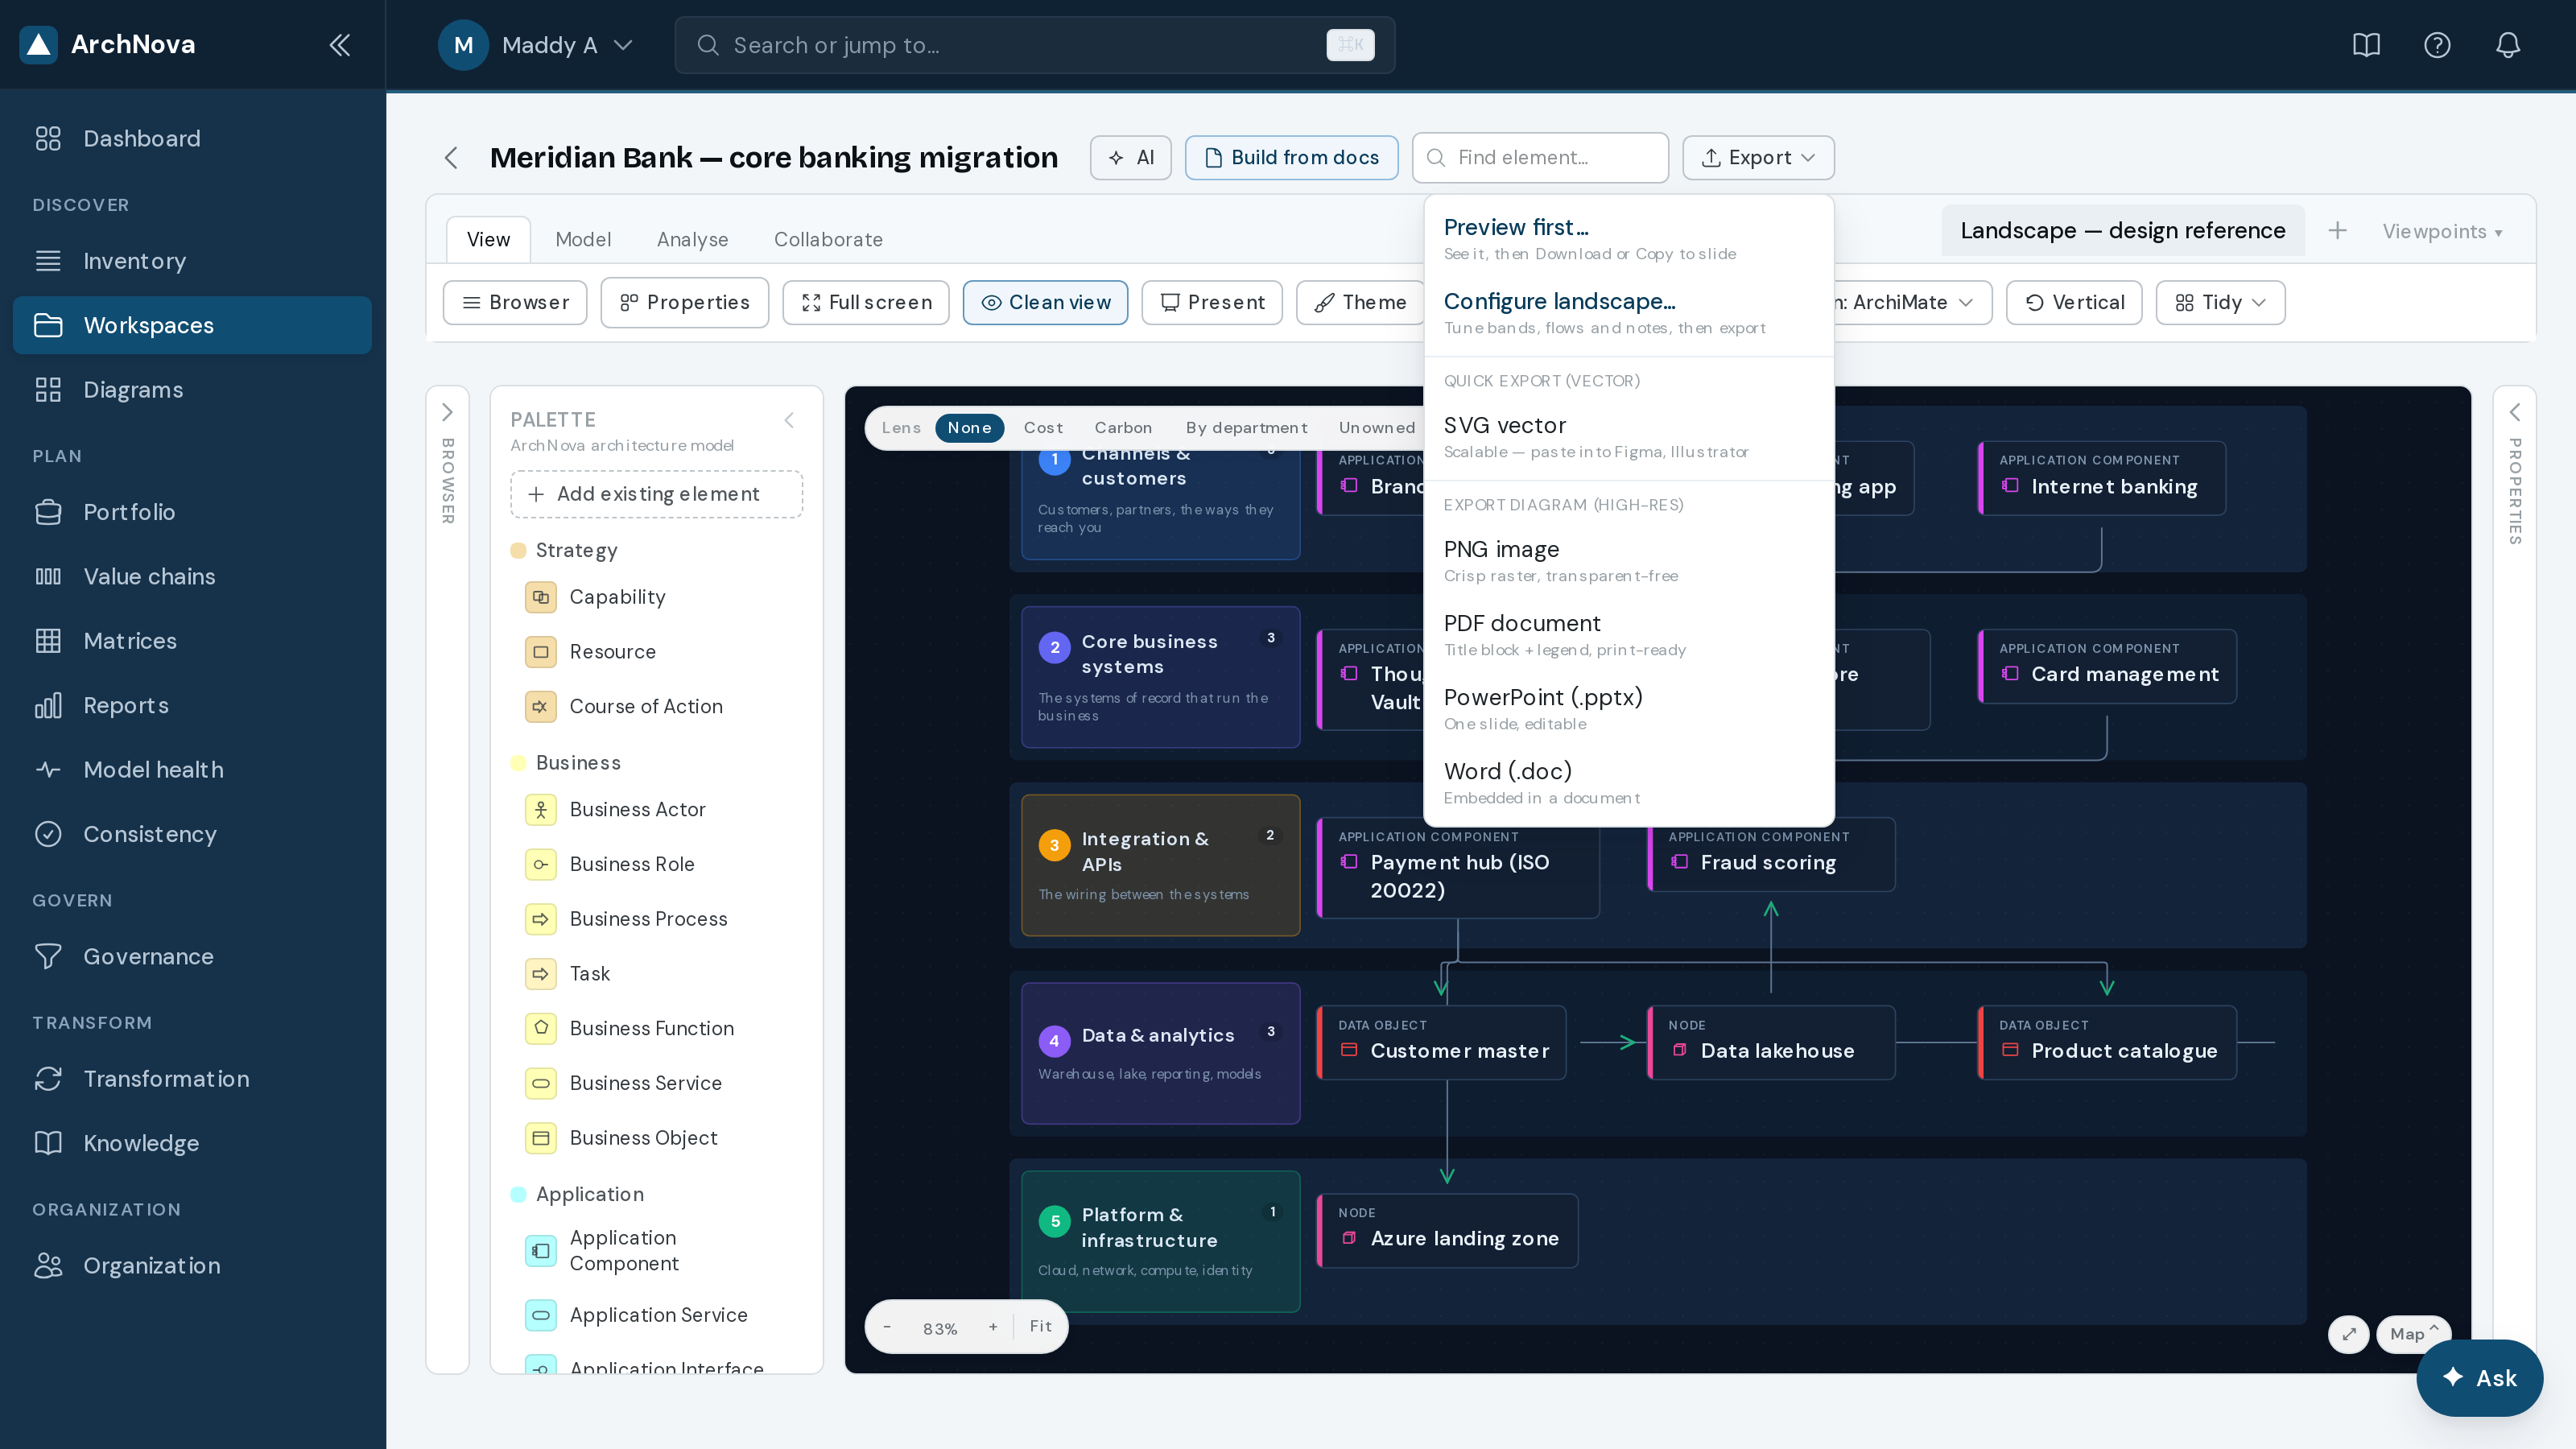
Export
PowerPoint gets native shapes — rectangles, flowchart symbols, connectors and text you can drag, recolour and retype, one slide per page. Vector stencil icons have no PowerPoint equivalent and become images; their labels and connectors stay native. SVG and PNG export the current page, and .drawio exports every page for anyone who needs the file elsewhere.
11Portfolio
Portfolio is lifecycle and investment across the estate: what to tolerate, invest in, migrate or eliminate. Its tab strip also carries Gap analysis, Capabilities, Maturity and Compare.
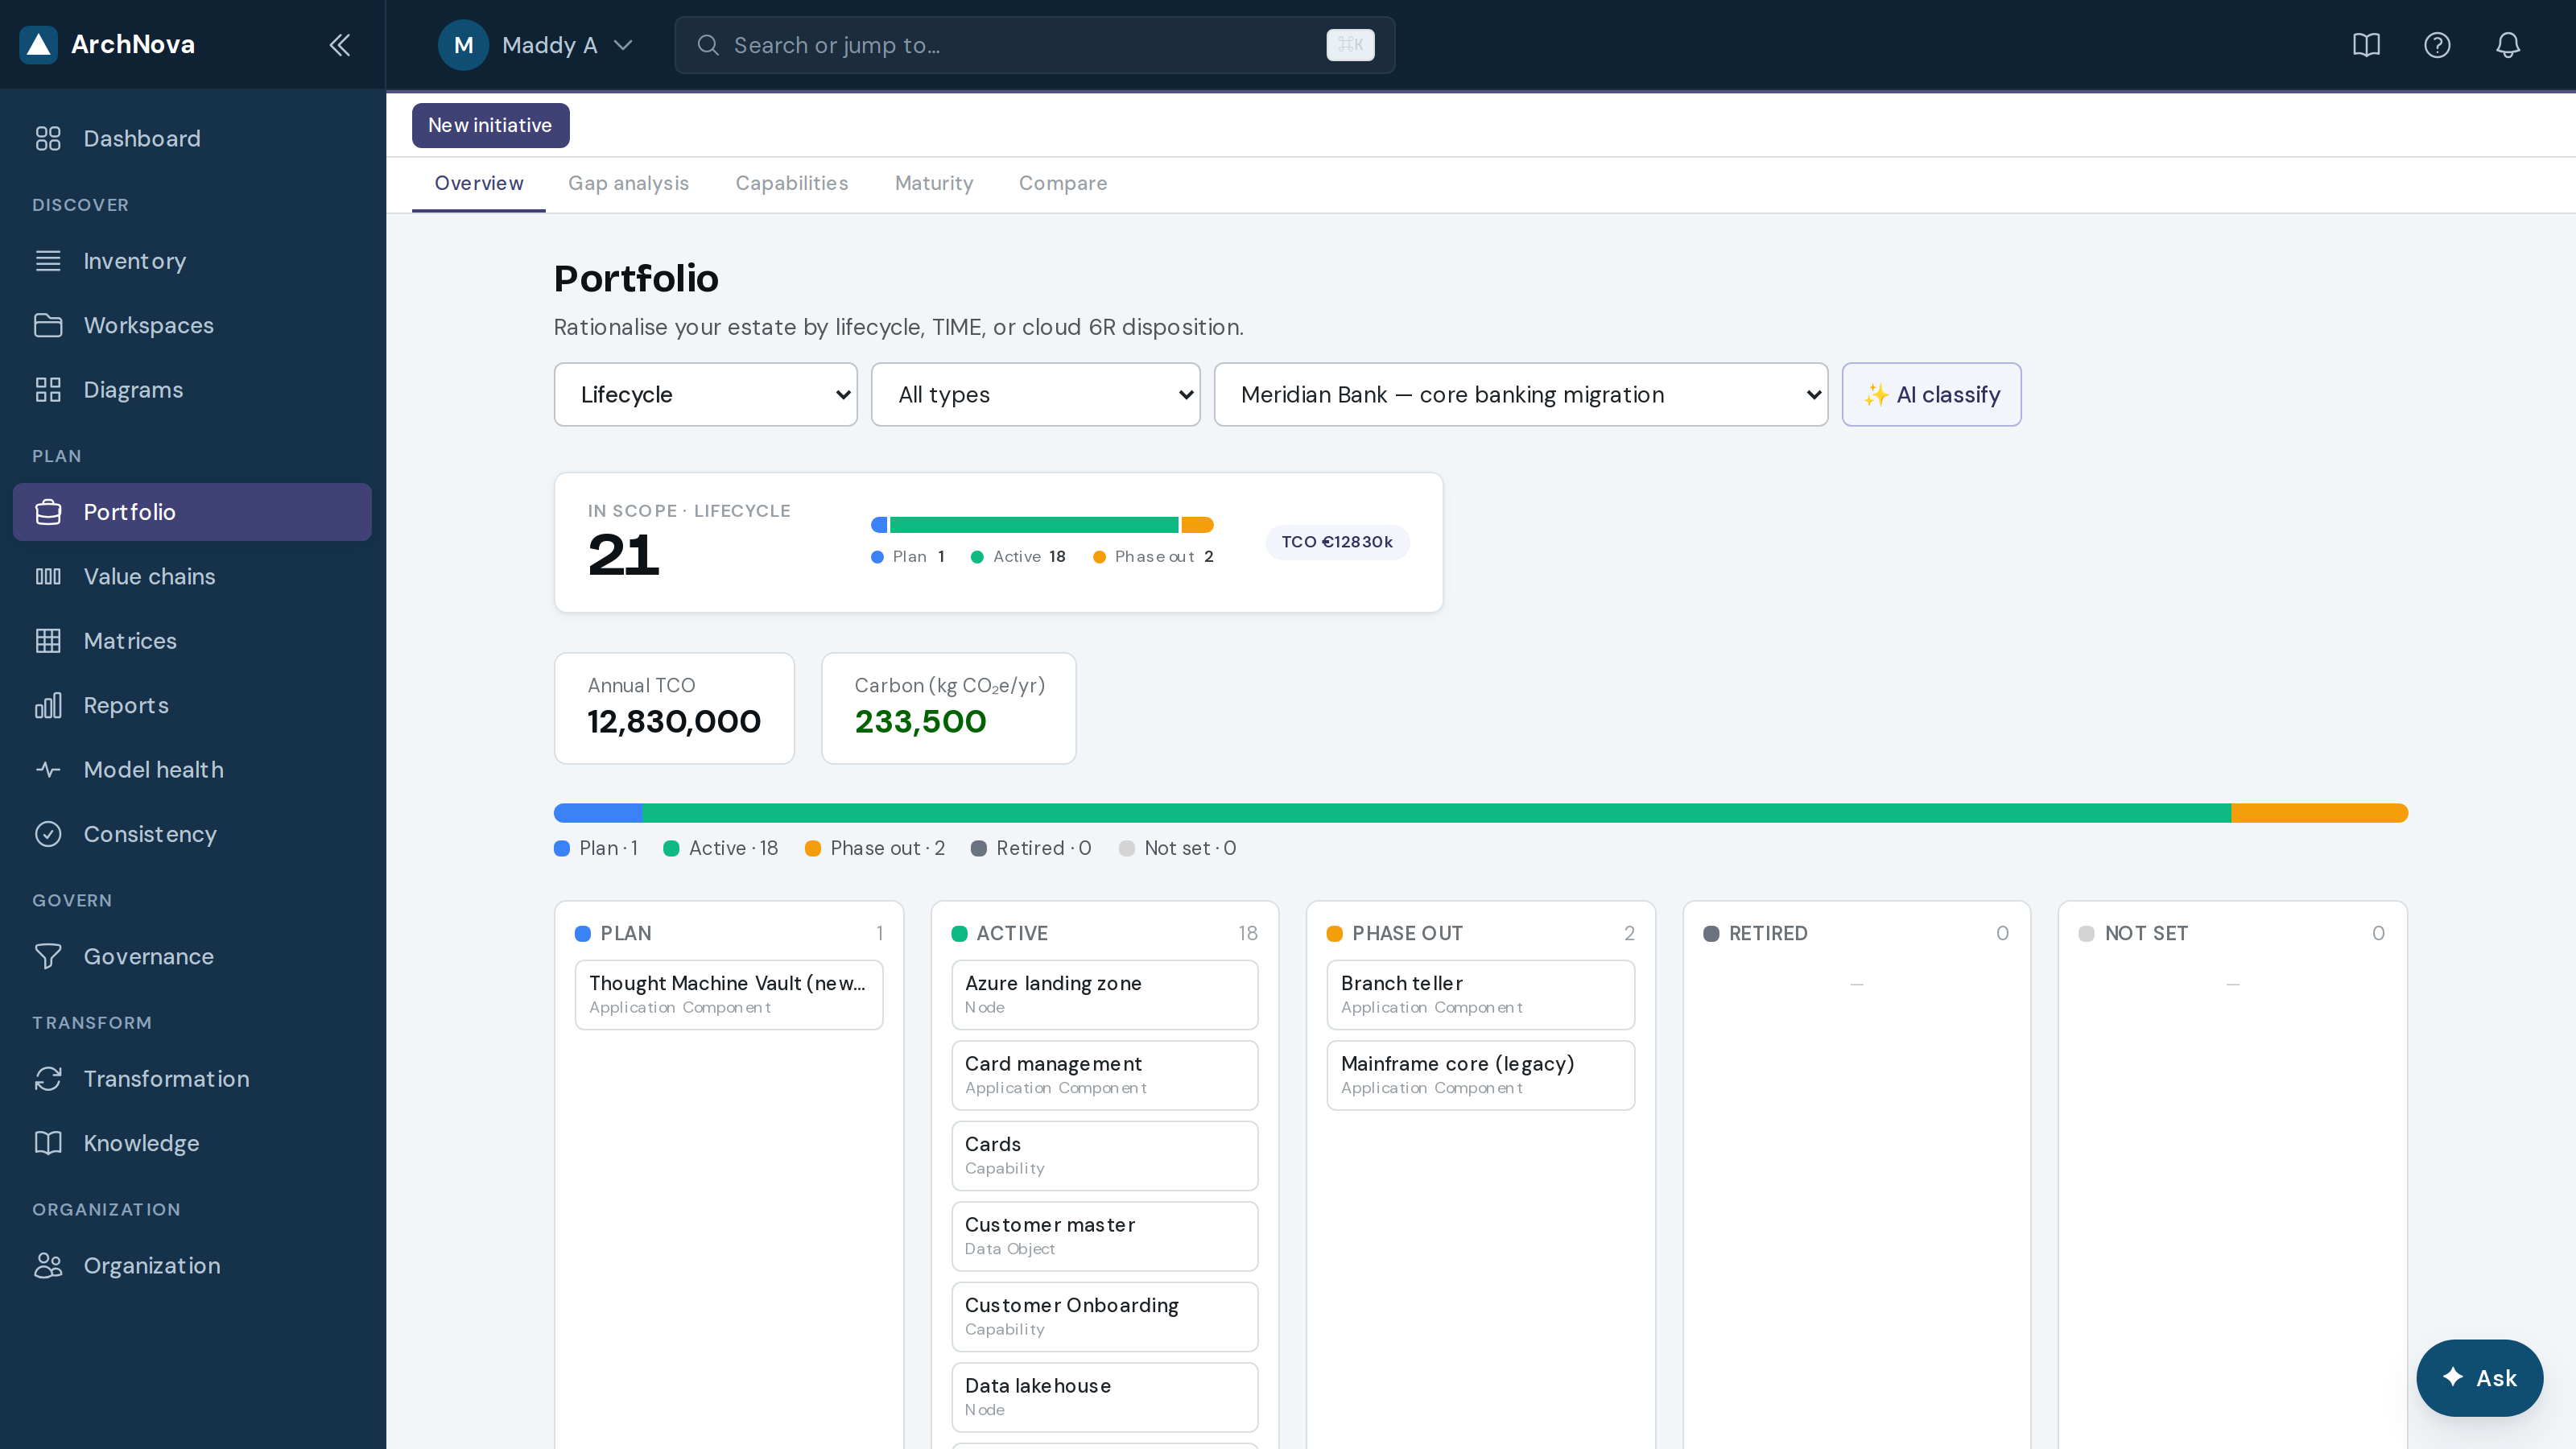
- Choose the workspace and, if you want, narrow to a single element type.
- Switch the grouping between lifecycle, TIME classification and cloud 6R disposition.
- Totals update with the filter, so you can answer “what does phasing out the mainframe actually save?” directly.
- Anything showing Not set is a gap in the data, not a finding — fix it in Inventory.
12Gap analysis
Gap analysis asks a blunt question: which capabilities and processes have no application actually supporting them, and which applications support nothing?
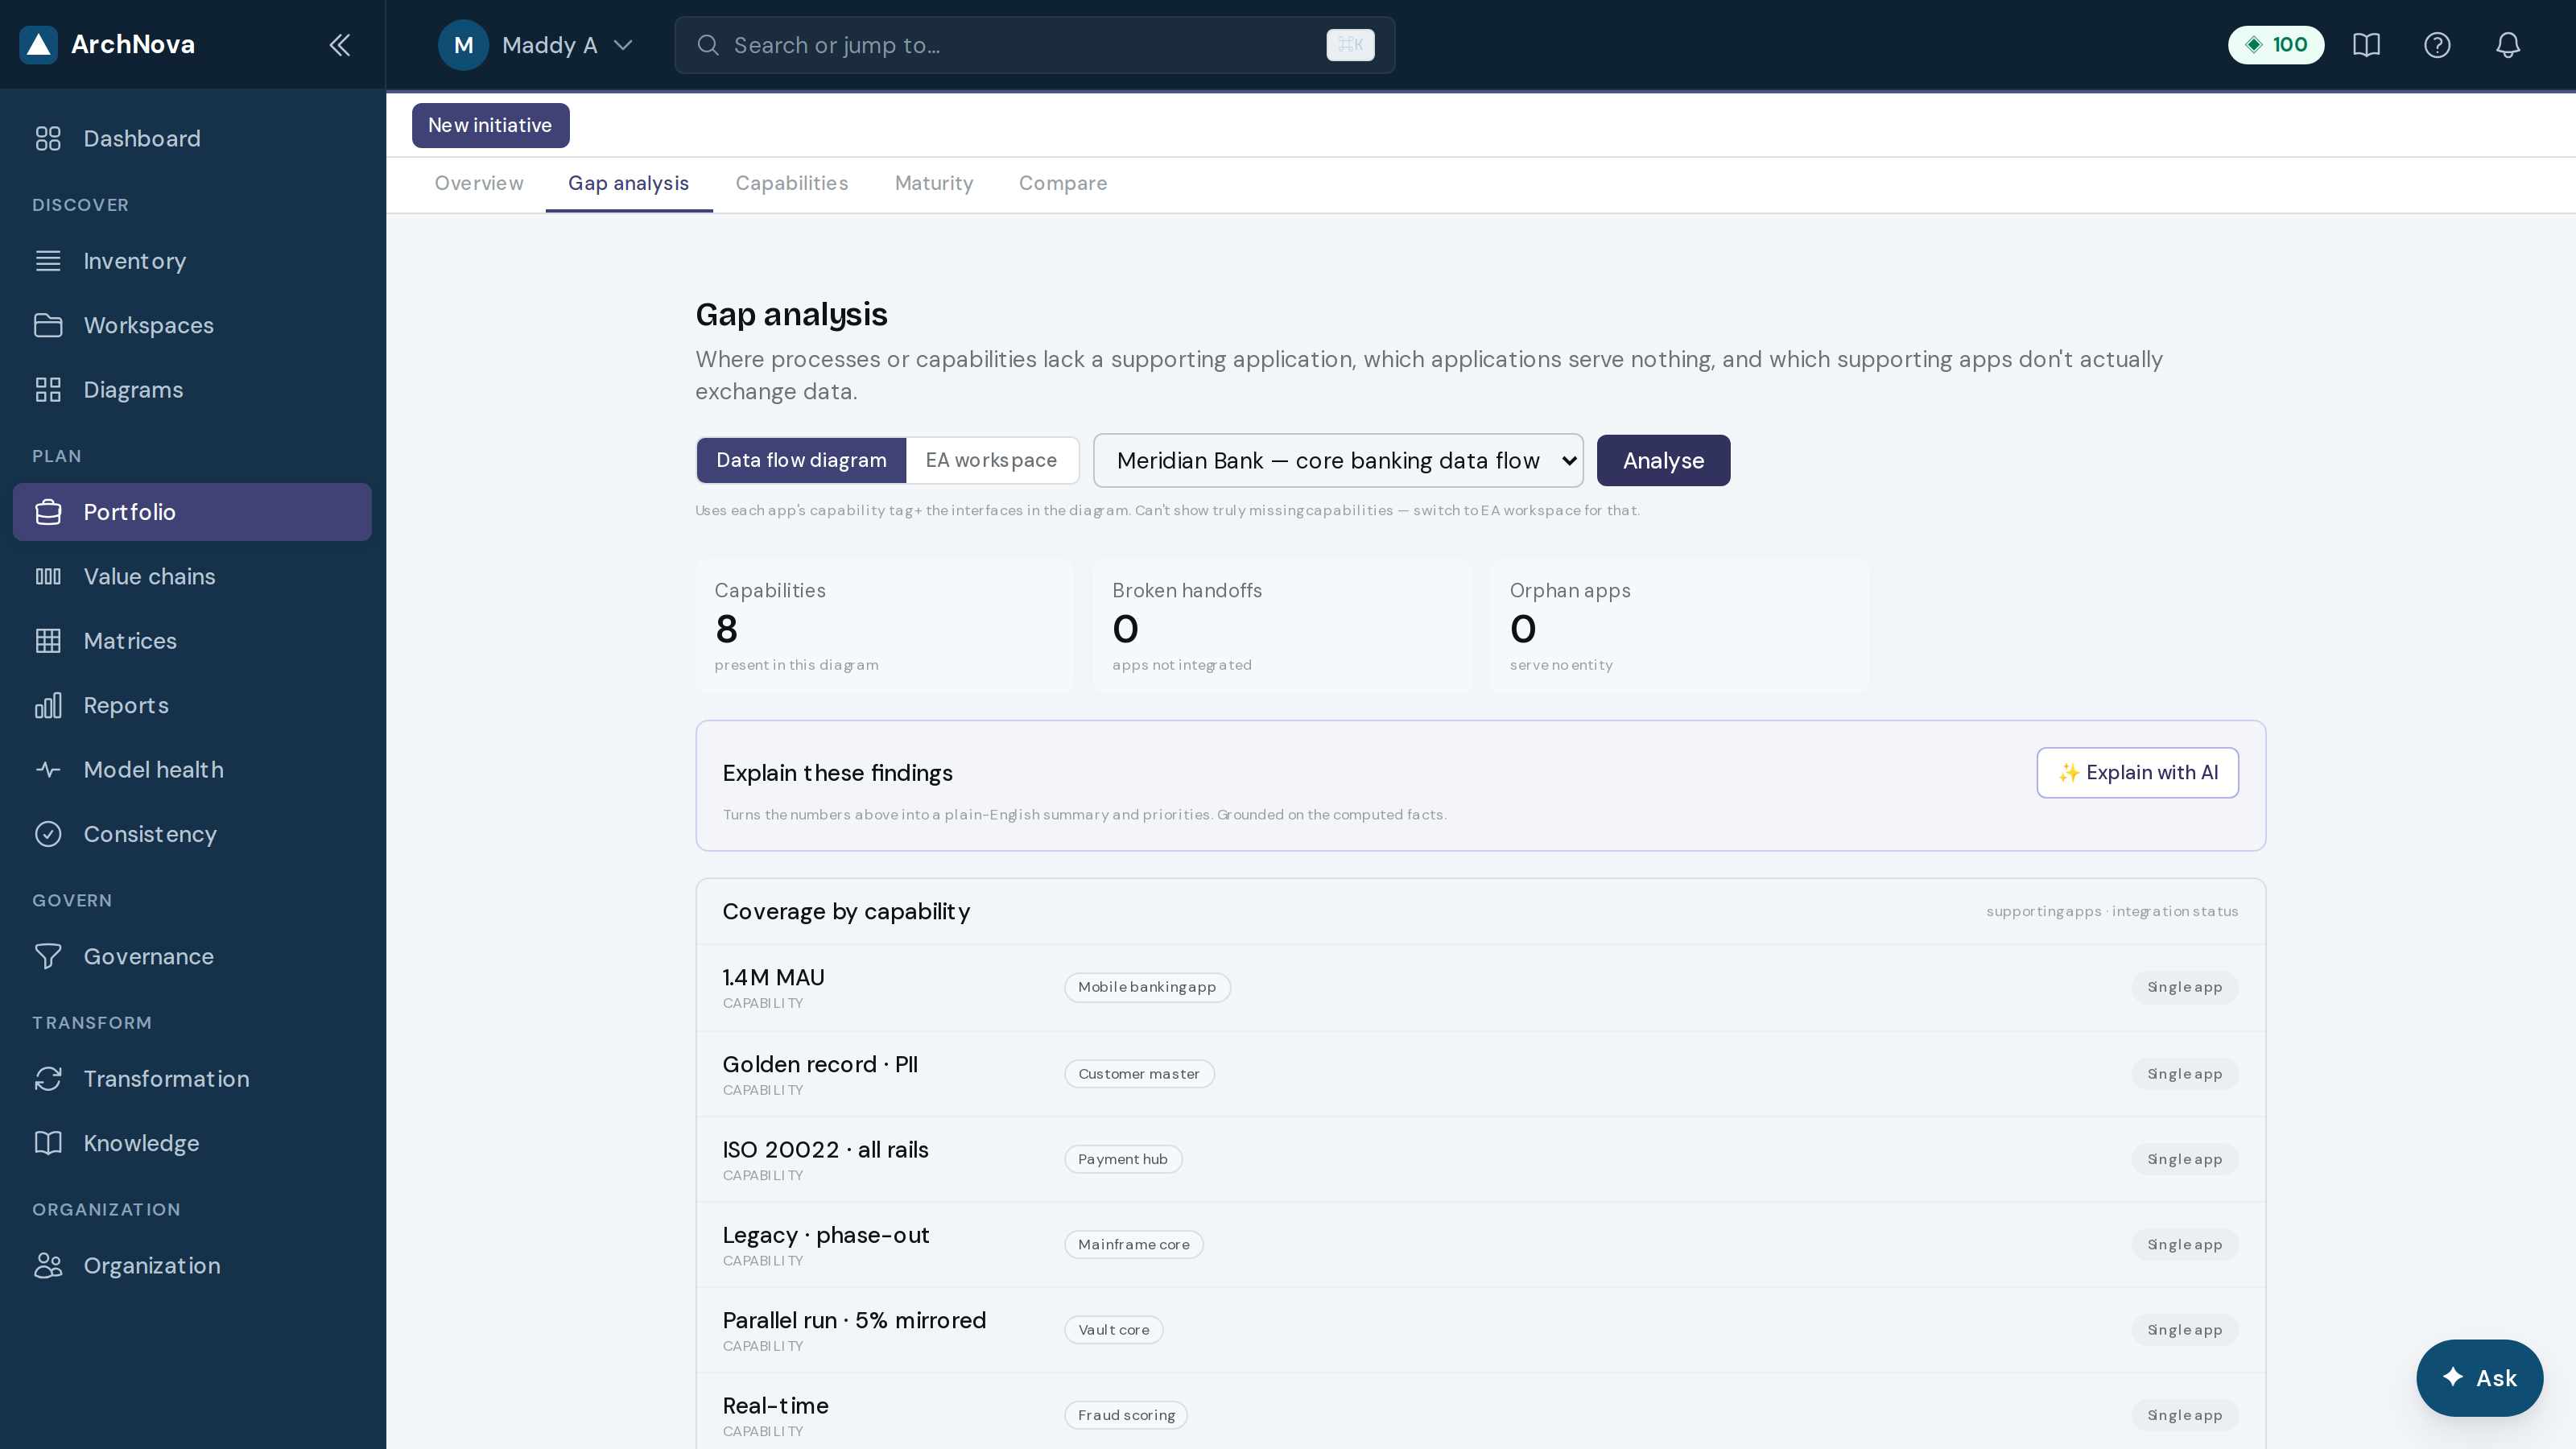
- Select the workspace (or a data flow diagram) and run Analyse.
- Coverage lists each capability and what supports it. An empty row is a real finding.
- Orphans are the reverse: applications that serve nothing in the model — often shadow IT, sometimes just an unfinished model.
- Export the result to take into a planning session.
13Capabilities
A capability map describes what the business does, independently of the systems that do it — the most durable view you can hold, and the right backdrop for a heatmap.
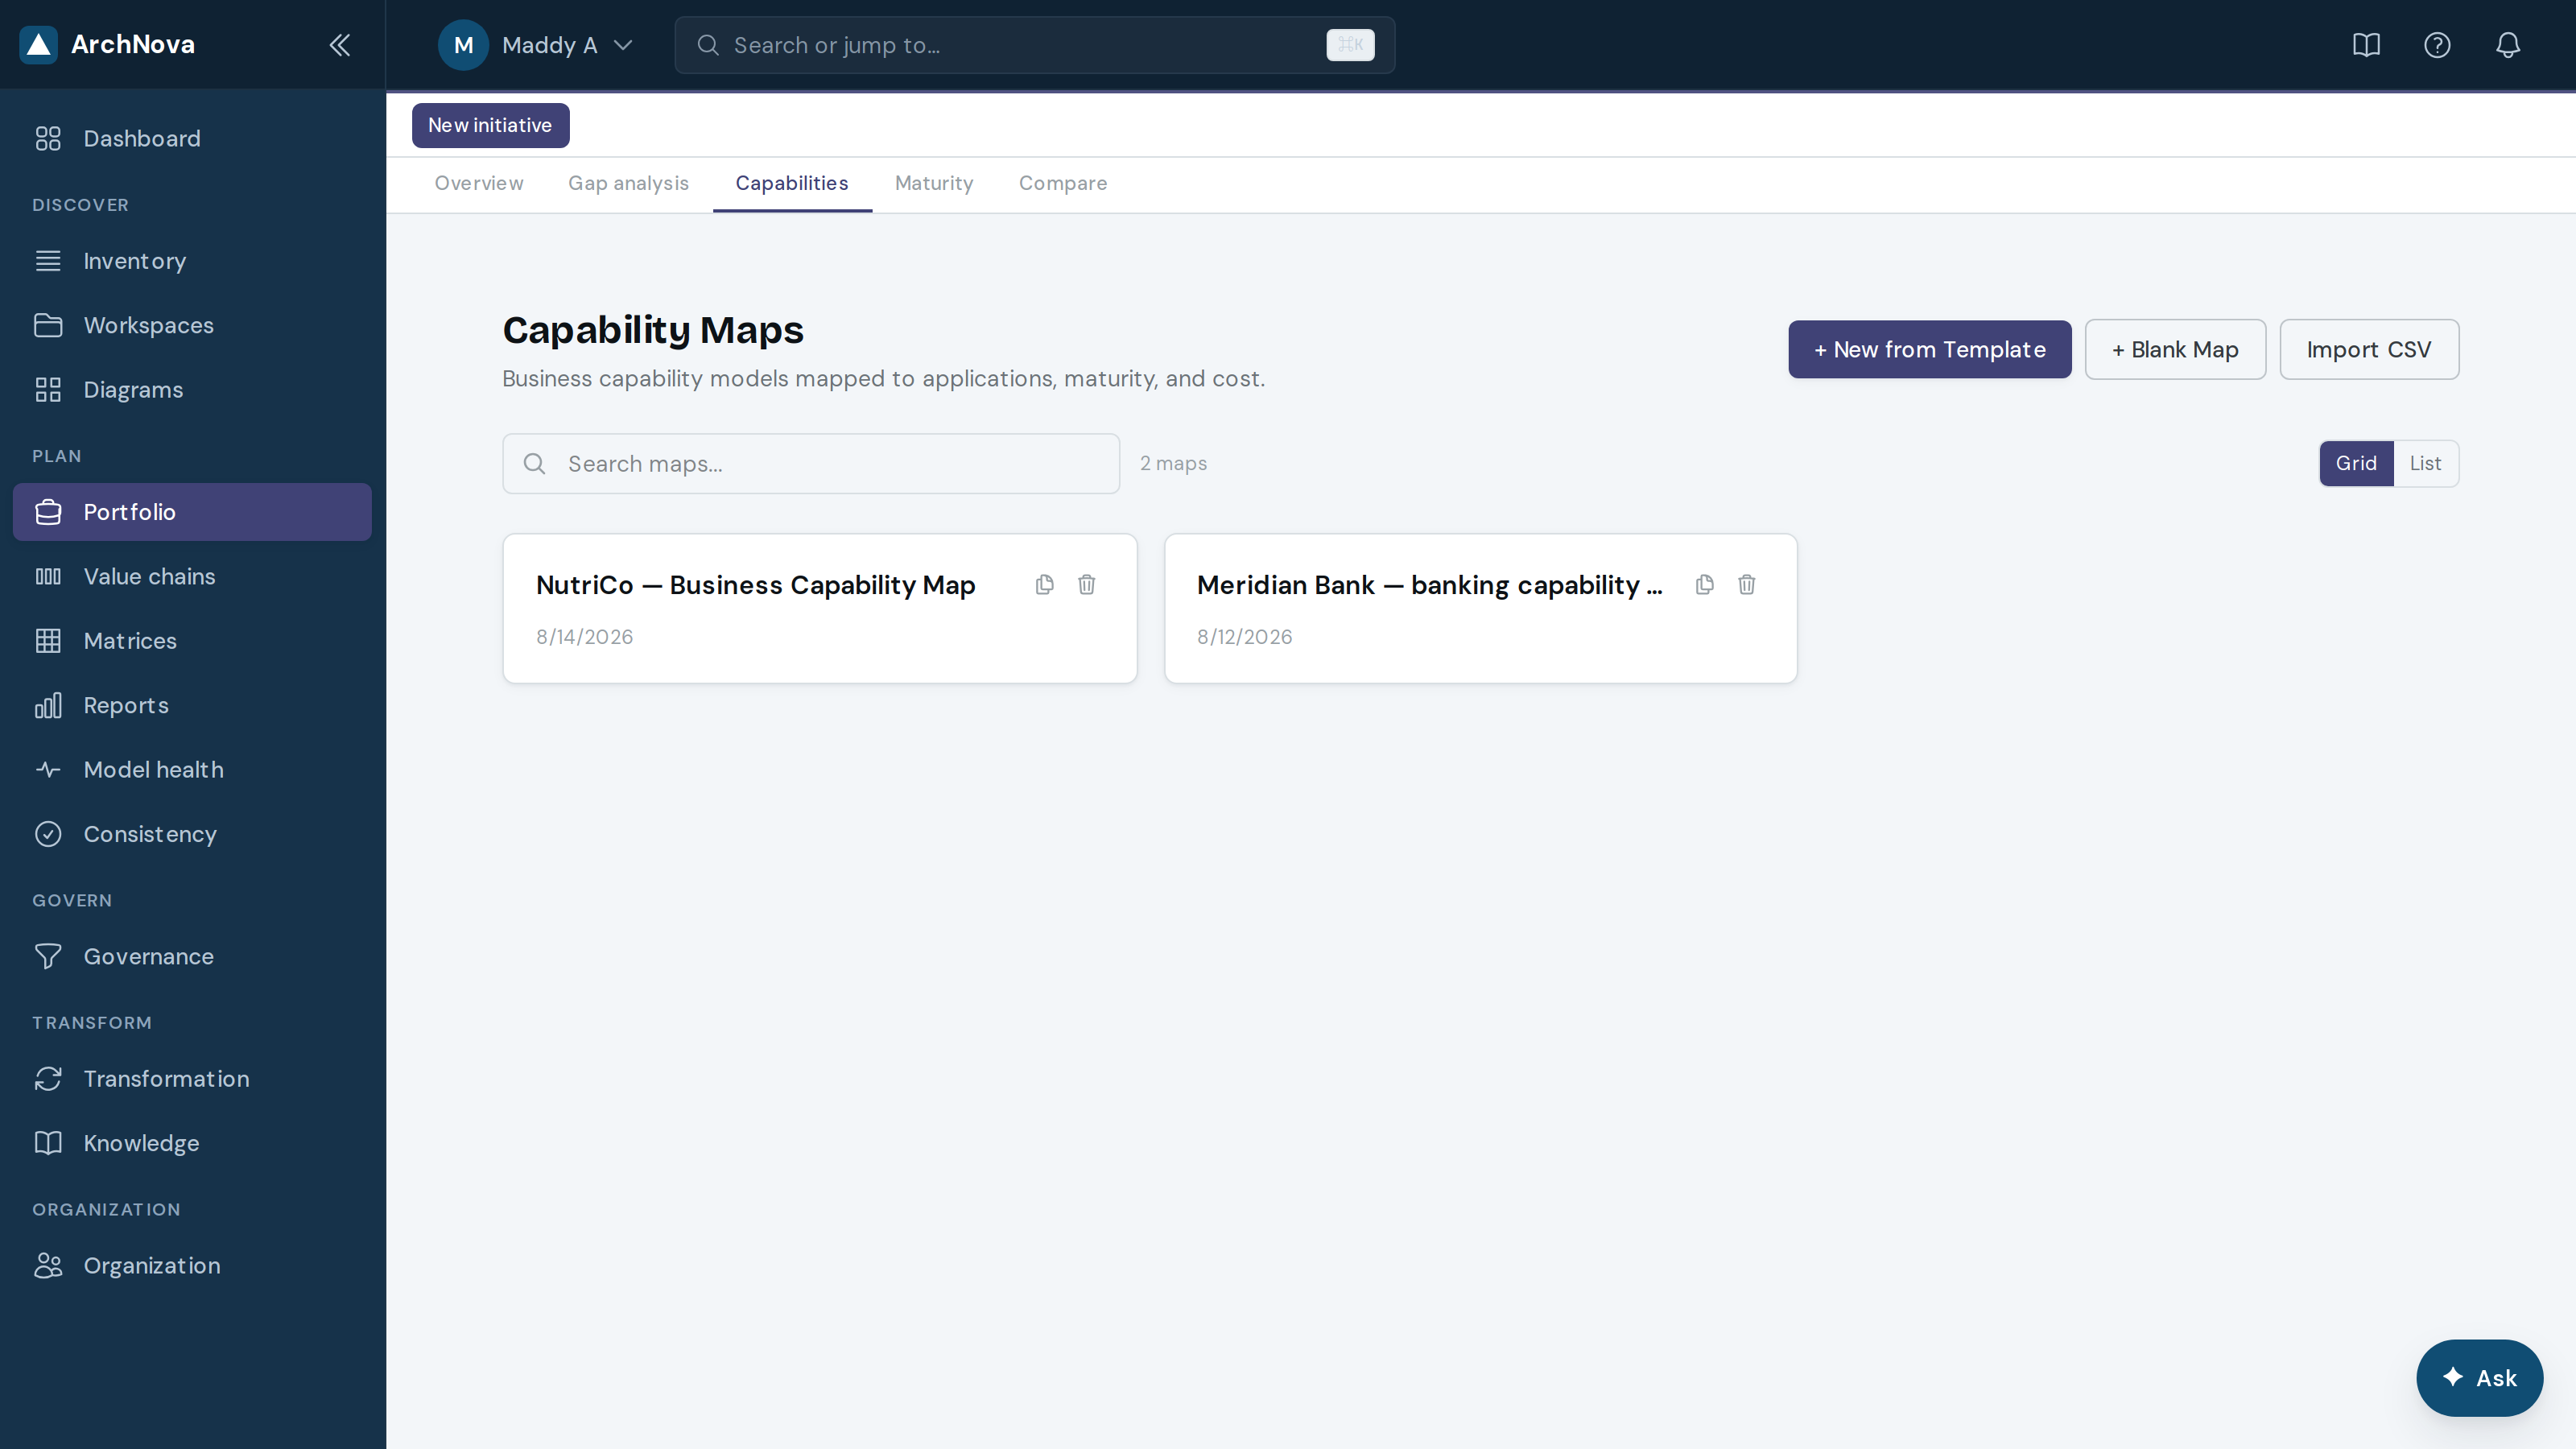
- Create a map from a template, from blank, or by importing a CSV taxonomy.
- Arrange capabilities into levels — domain, capability, sub-capability.
- Shade the map by maturity, cost or criticality to turn it into a heatmap for investment conversations.
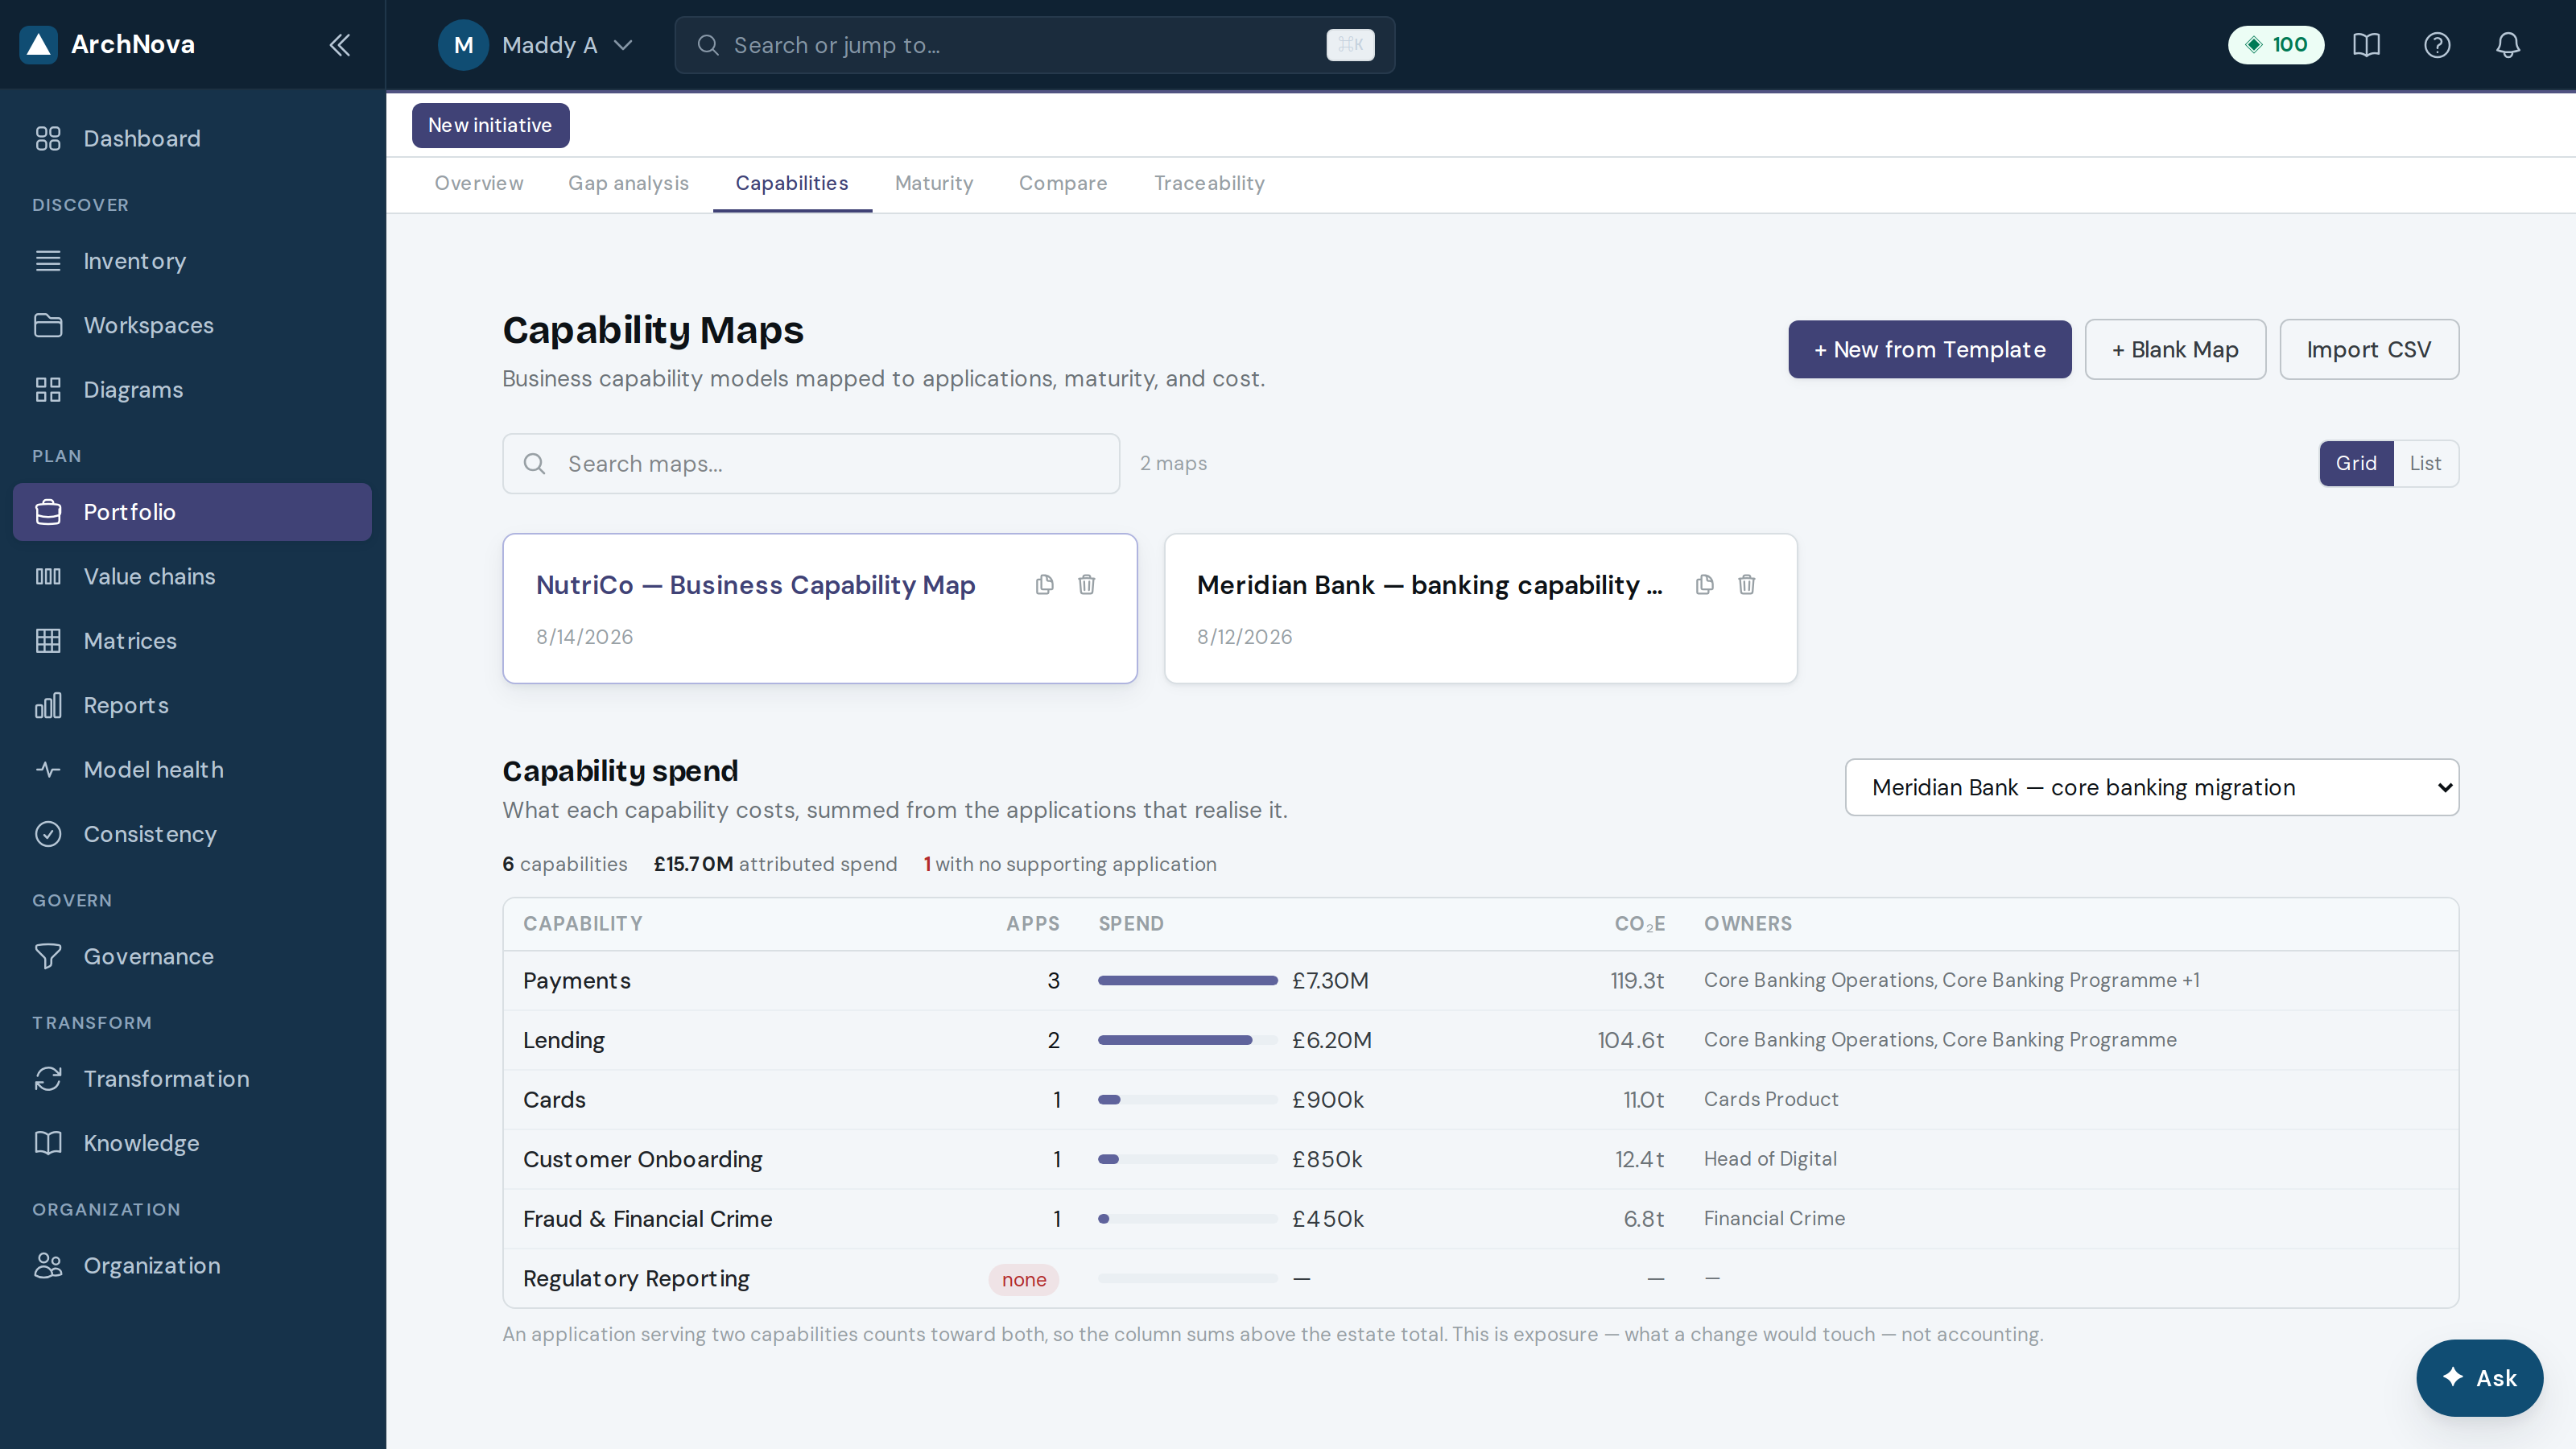
Capability spend
Below the maps, Capability spend totals what each capability costs by summing the applications that realise it — the number a capability map cannot give you on its own.
14Maturity
A maturity assessment scores the estate against a set of dimensions and tracks the score over time.
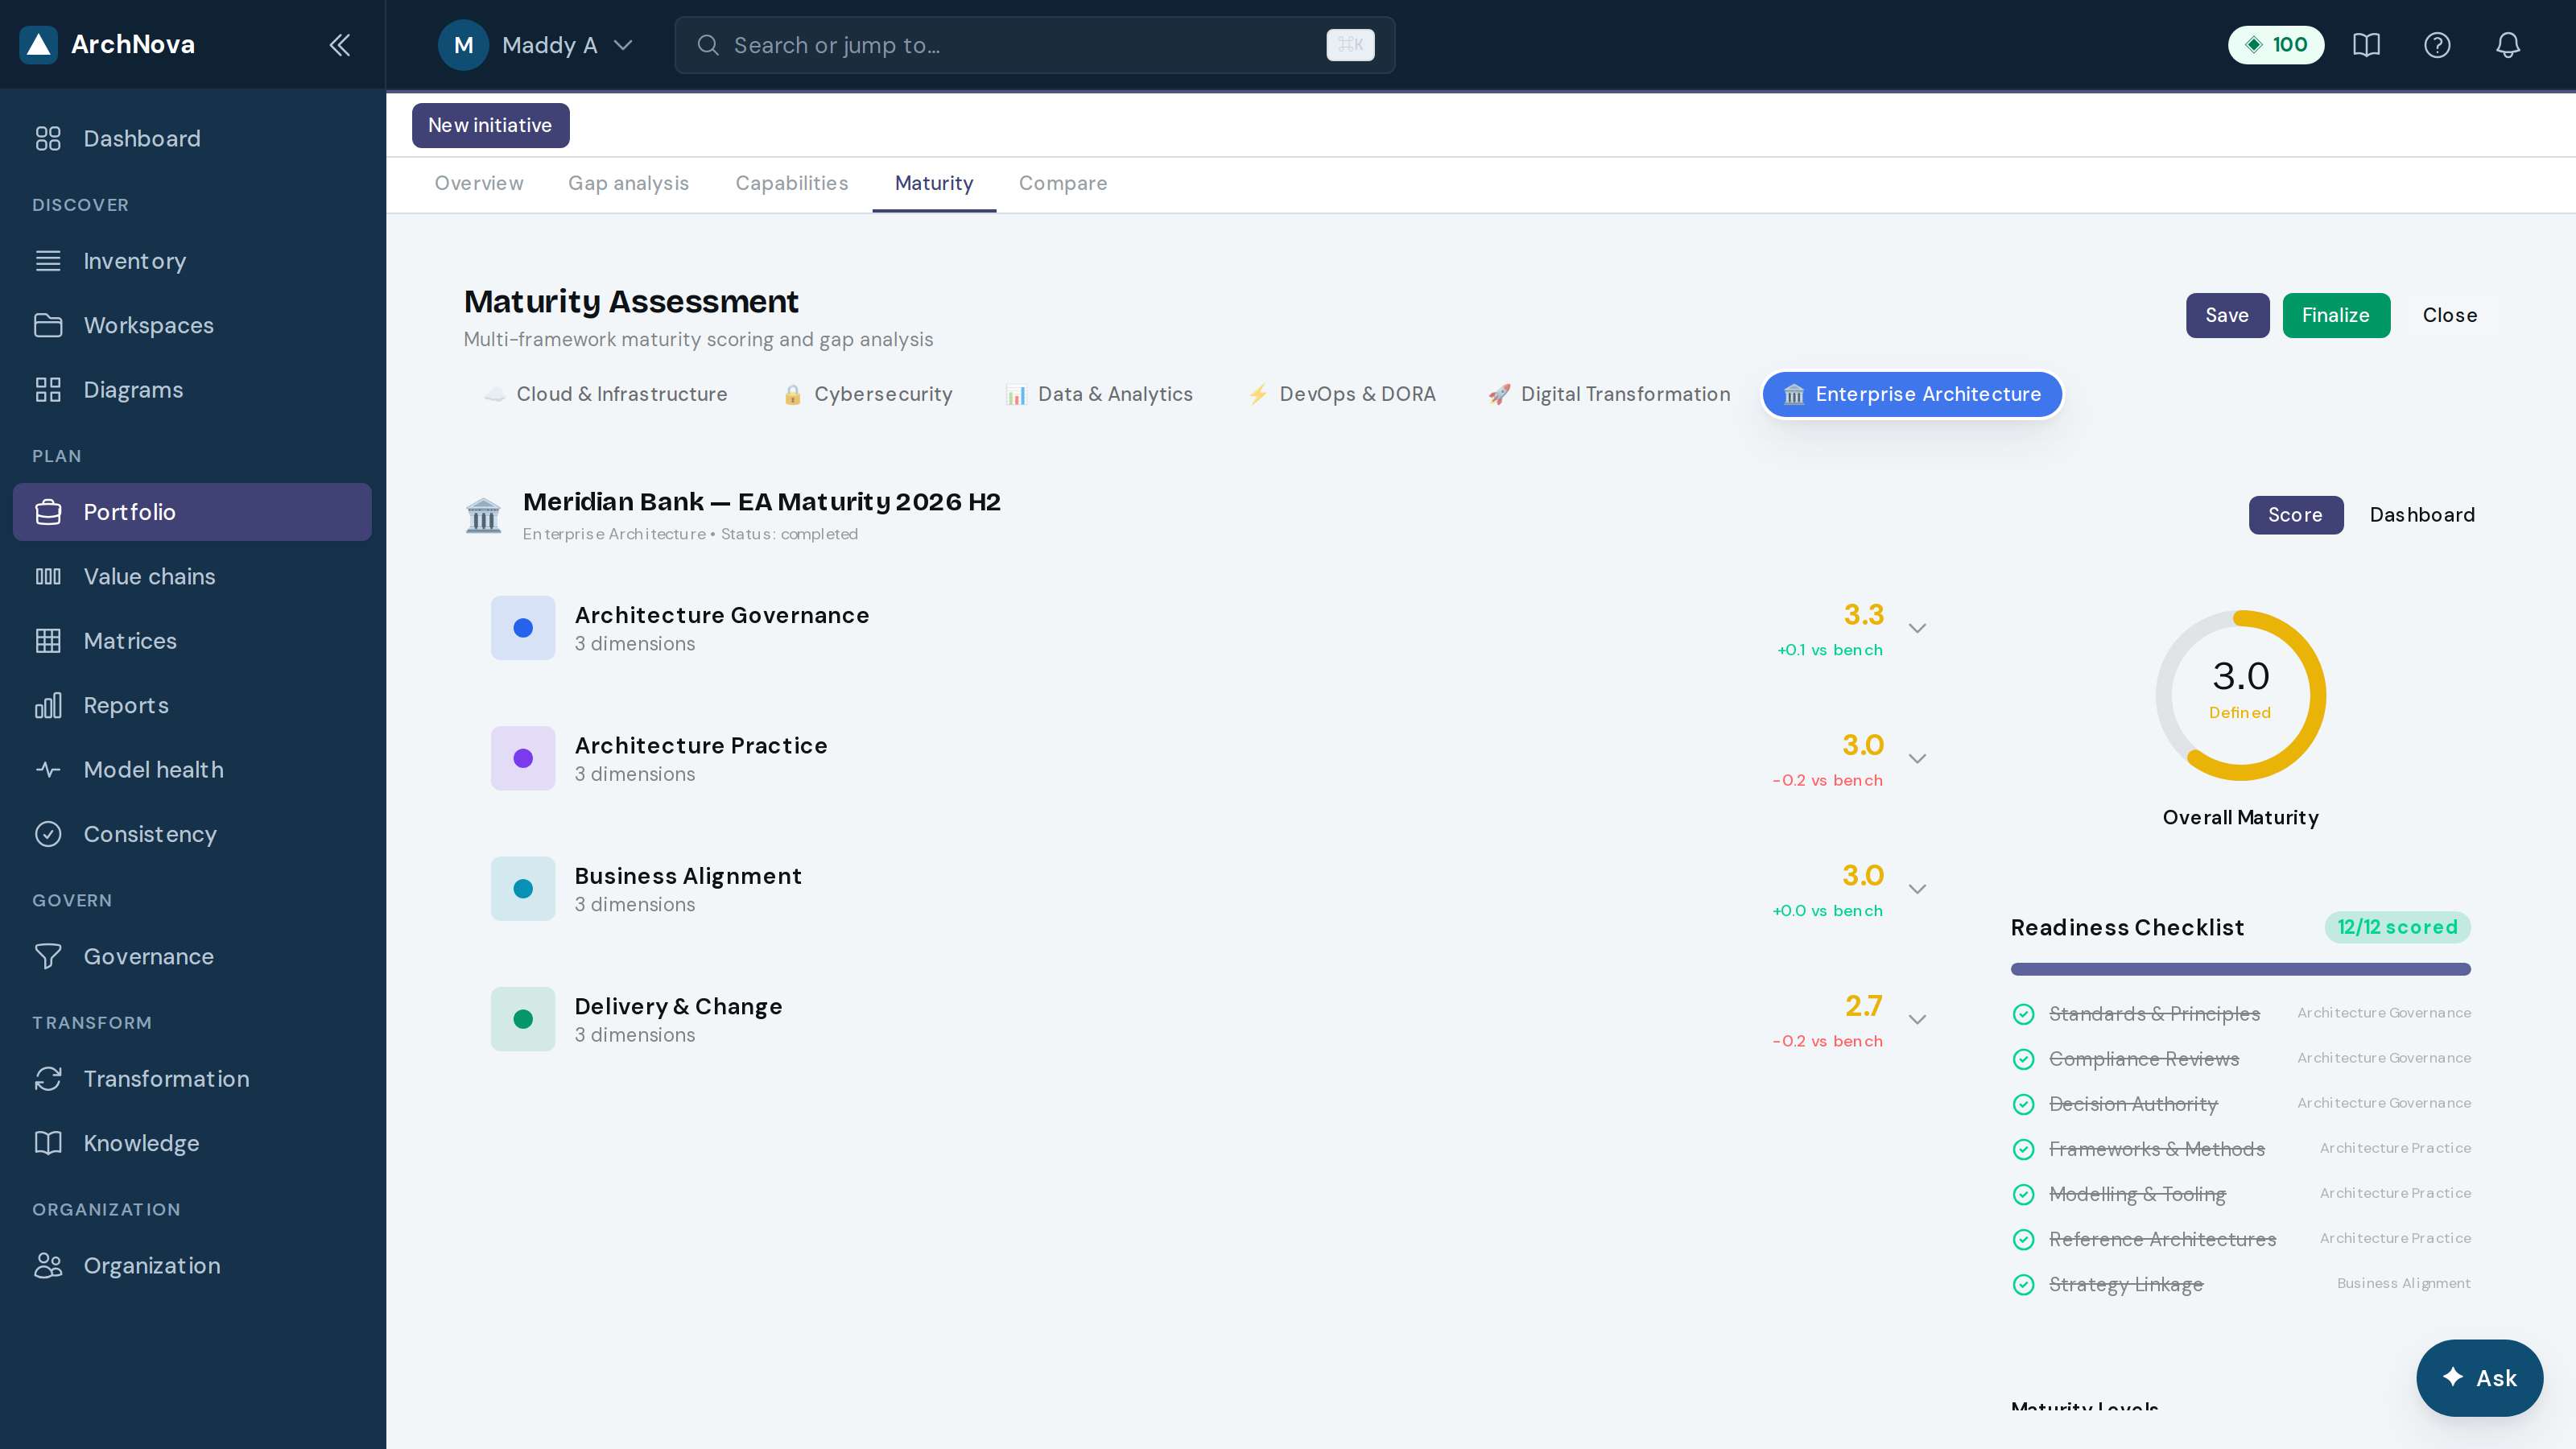
- Select New assessment and pick a framework — Enterprise Architecture, Cloud, Data & Analytics, Cybersecurity, DevOps or Digital Transformation.
- Score each dimension 0–5 and record the evidence behind the score. The readiness checklist tracks how many of the dimensions you have scored.
- Each score is compared against the framework’s benchmark, so you see where you are genuinely behind rather than uniformly average.
- Finalize when complete, then re-run it each quarter — the value is in the trend, not the first number.
15Compare
Compare puts two workspaces side by side and shows what exists in one, the other, or both. It was built for M&A due diligence and for “current versus target” planning.
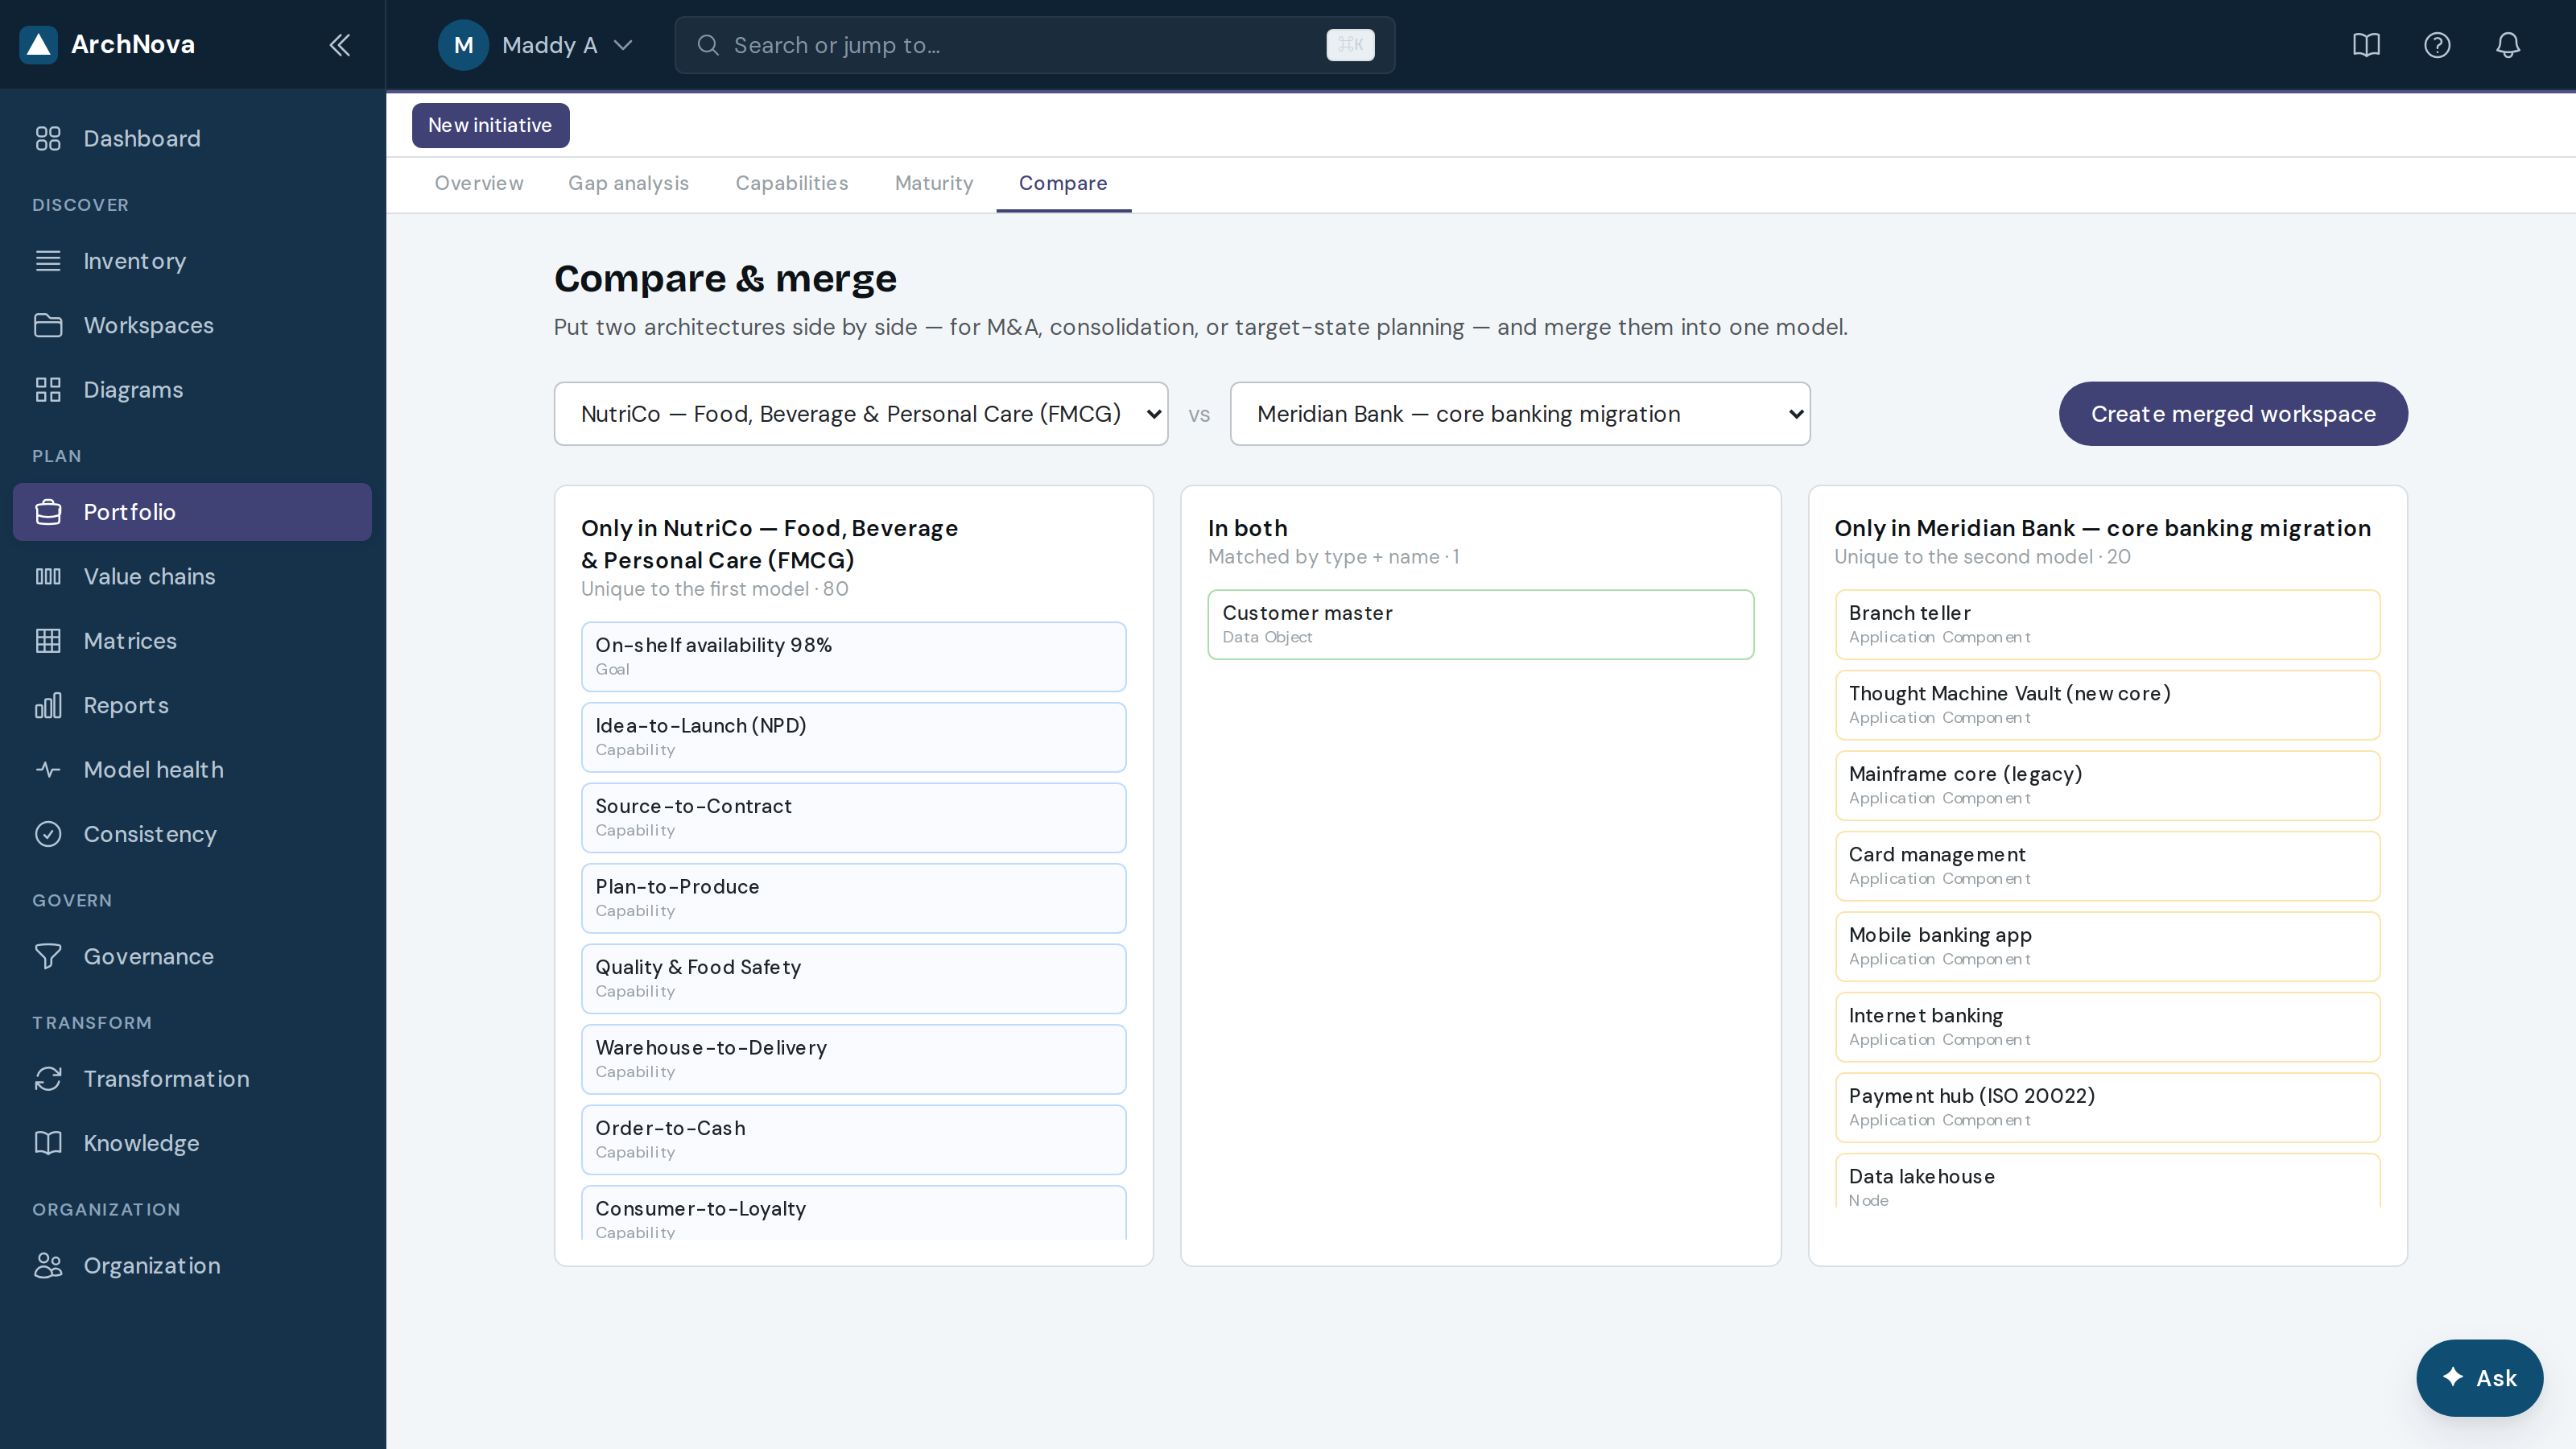
- Pick the two workspaces to compare.
- Read the three columns: overlap in the middle is consolidation opportunity; the outer columns are what each side brings.
- Create merged workspace produces a combined model you can then rationalise.
16Traceability
One screen that walks the whole chain — strategy, capabilities, business, applications, AI, data, cloud — and shows what is bound to every element along the way.
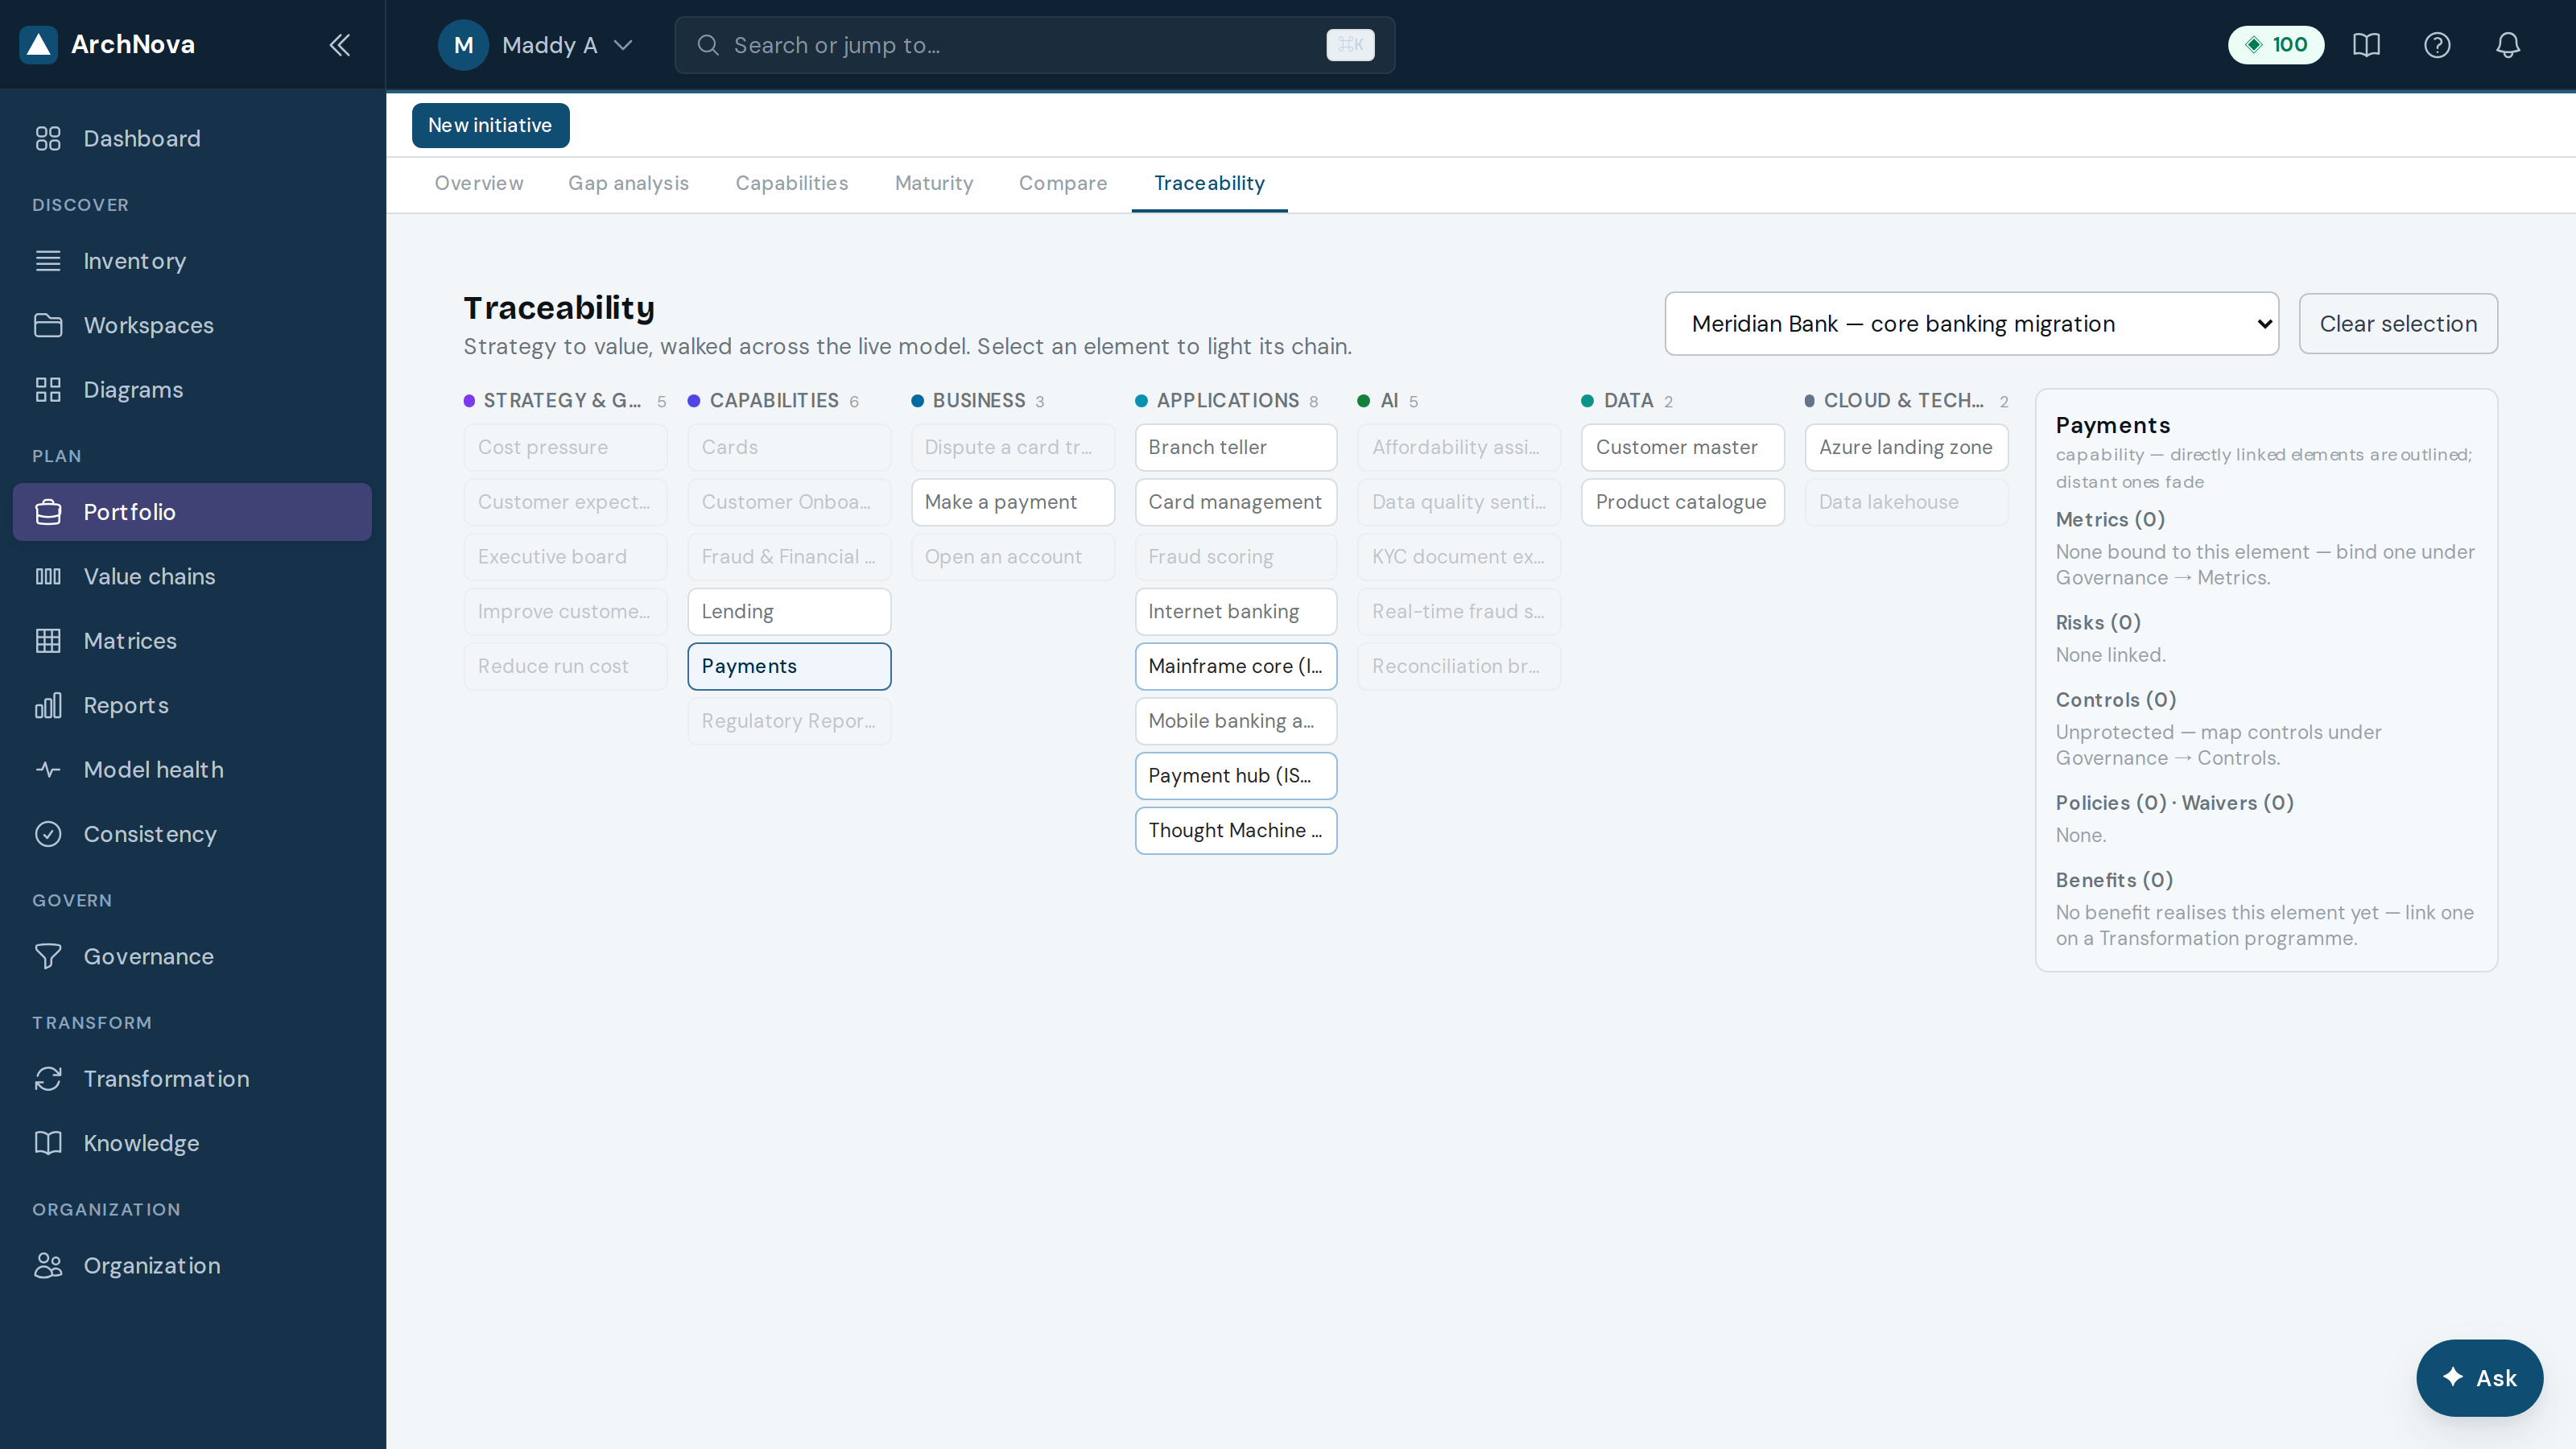
- Pick a workspace. Each column is one layer of the chain, with its element count.
- Select any element — everything reachable from it, up and down the chain, stays lit while the rest fades. That is the trace.
- The right panel shows what is bound to your selection: metrics, risks, controls, policies, waivers and benefits.
- With nothing selected the panel shows the whole workspace, so unbound items read as findings rather than hiding.
17Value chains
A value chain lays out how value reaches the customer end to end, then hangs the supporting systems off each stage — the clearest way to show a business audience where the architecture actually bites.
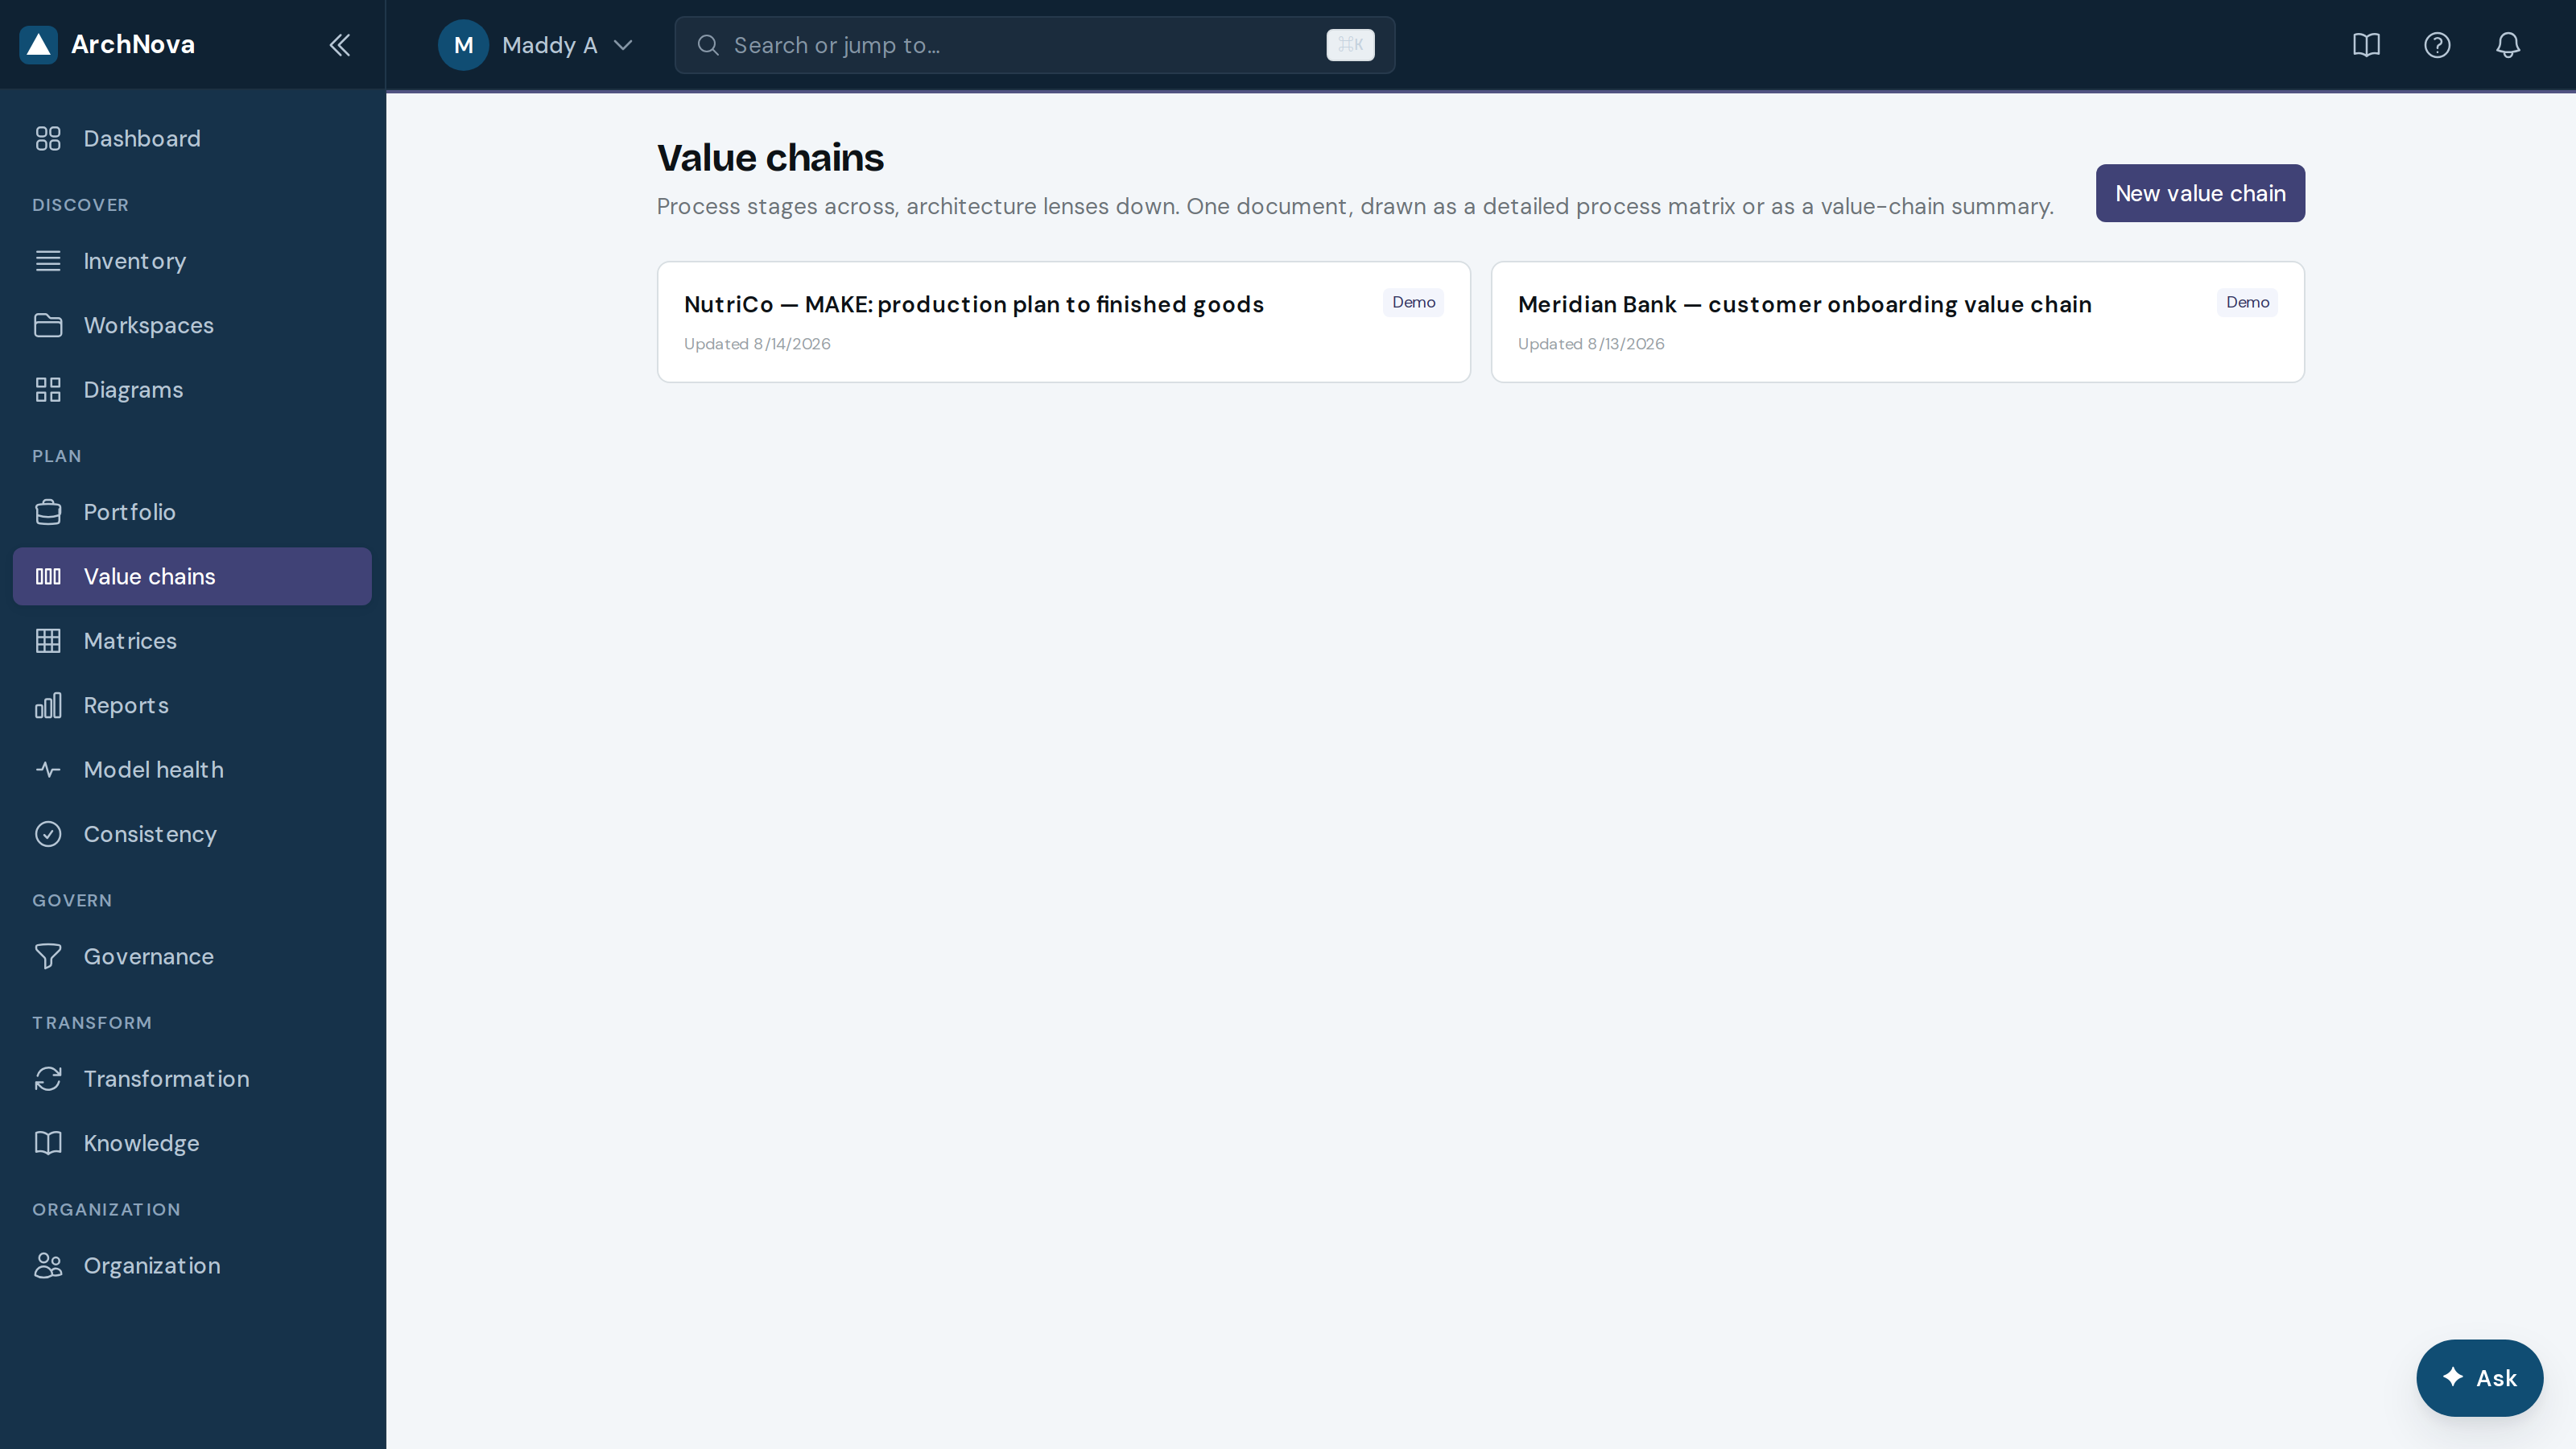
- Select New value chain and name the stages in order.
- Attach capabilities and applications to each stage.
- Shade by cost or maturity to show which stage is starved.
18Matrices
Matrices are the grid artefacts an architecture practice keeps needing: RACI, CRUD, SIPOC and risk heat maps, generated against real elements rather than typed into a spreadsheet.
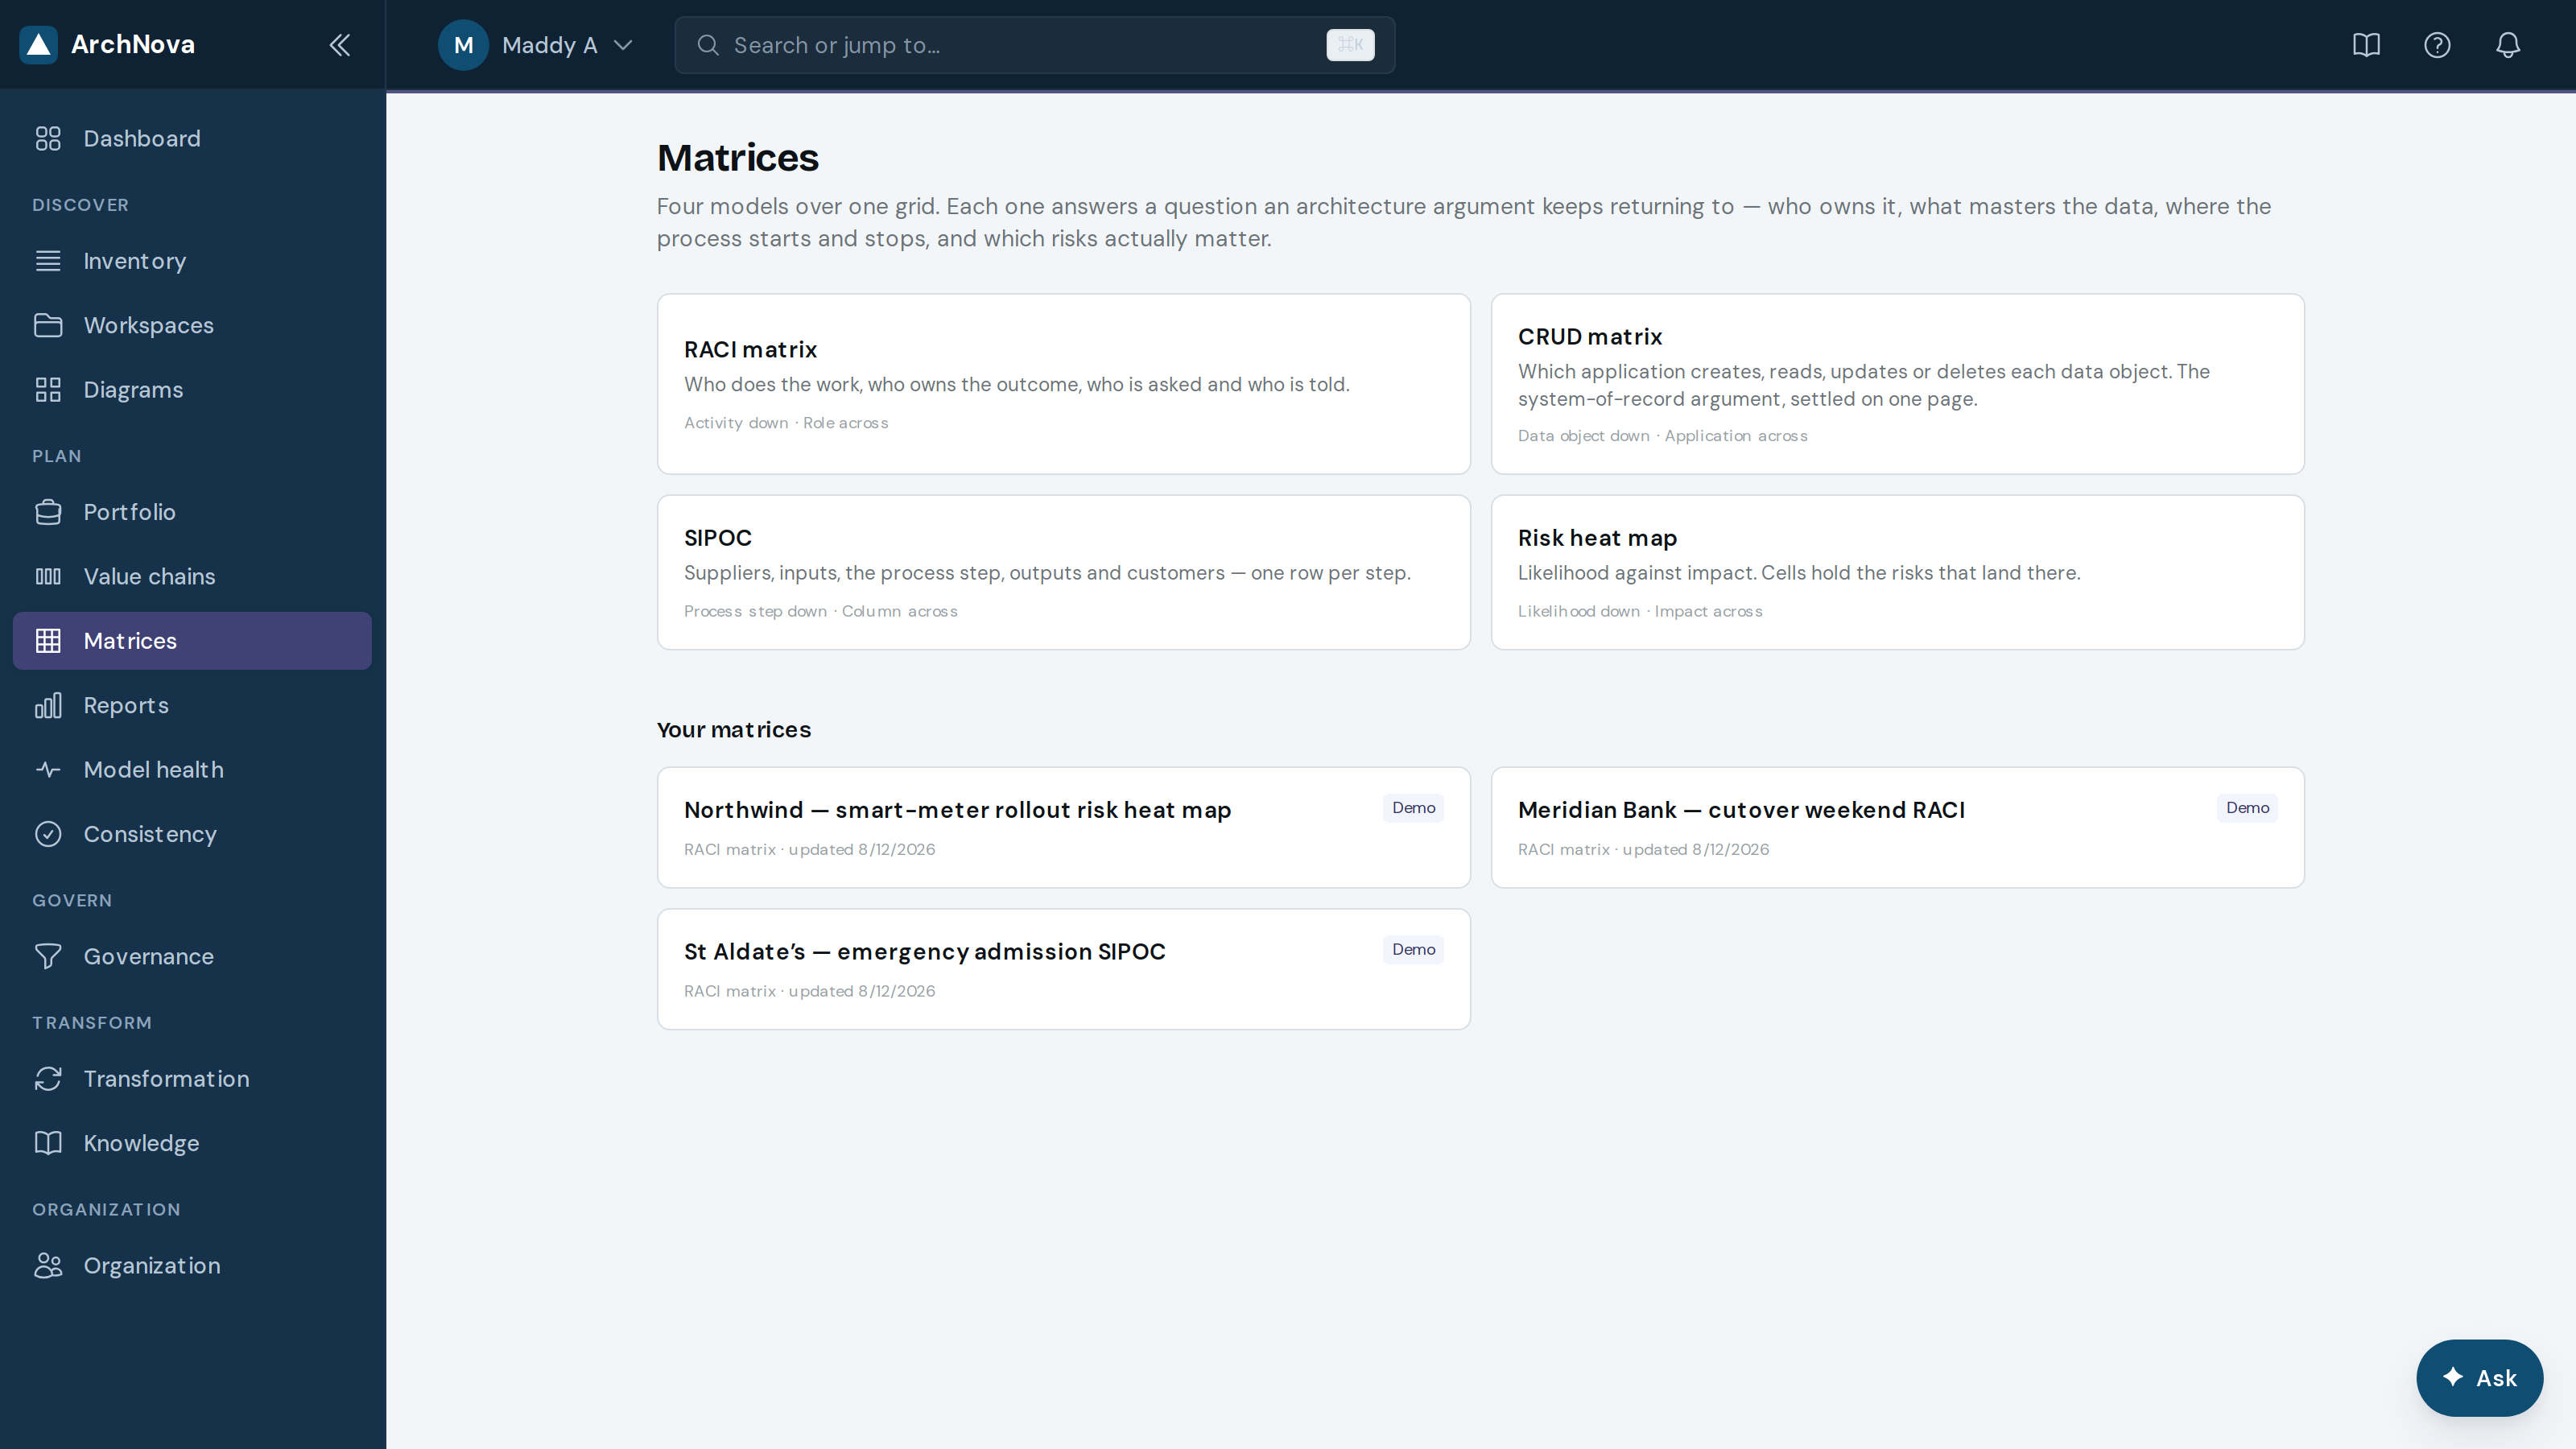
- Choose a matrix type; rows and columns are populated from the model.
- Click a cell to set its value. The RACI editor enforces exactly one Accountable per row as you type.
- Export to PPTX or CSV for the pack.
19Model health
Model health scores how much you can trust the model, and detects drift between what the model says and what it said last time it was scanned.
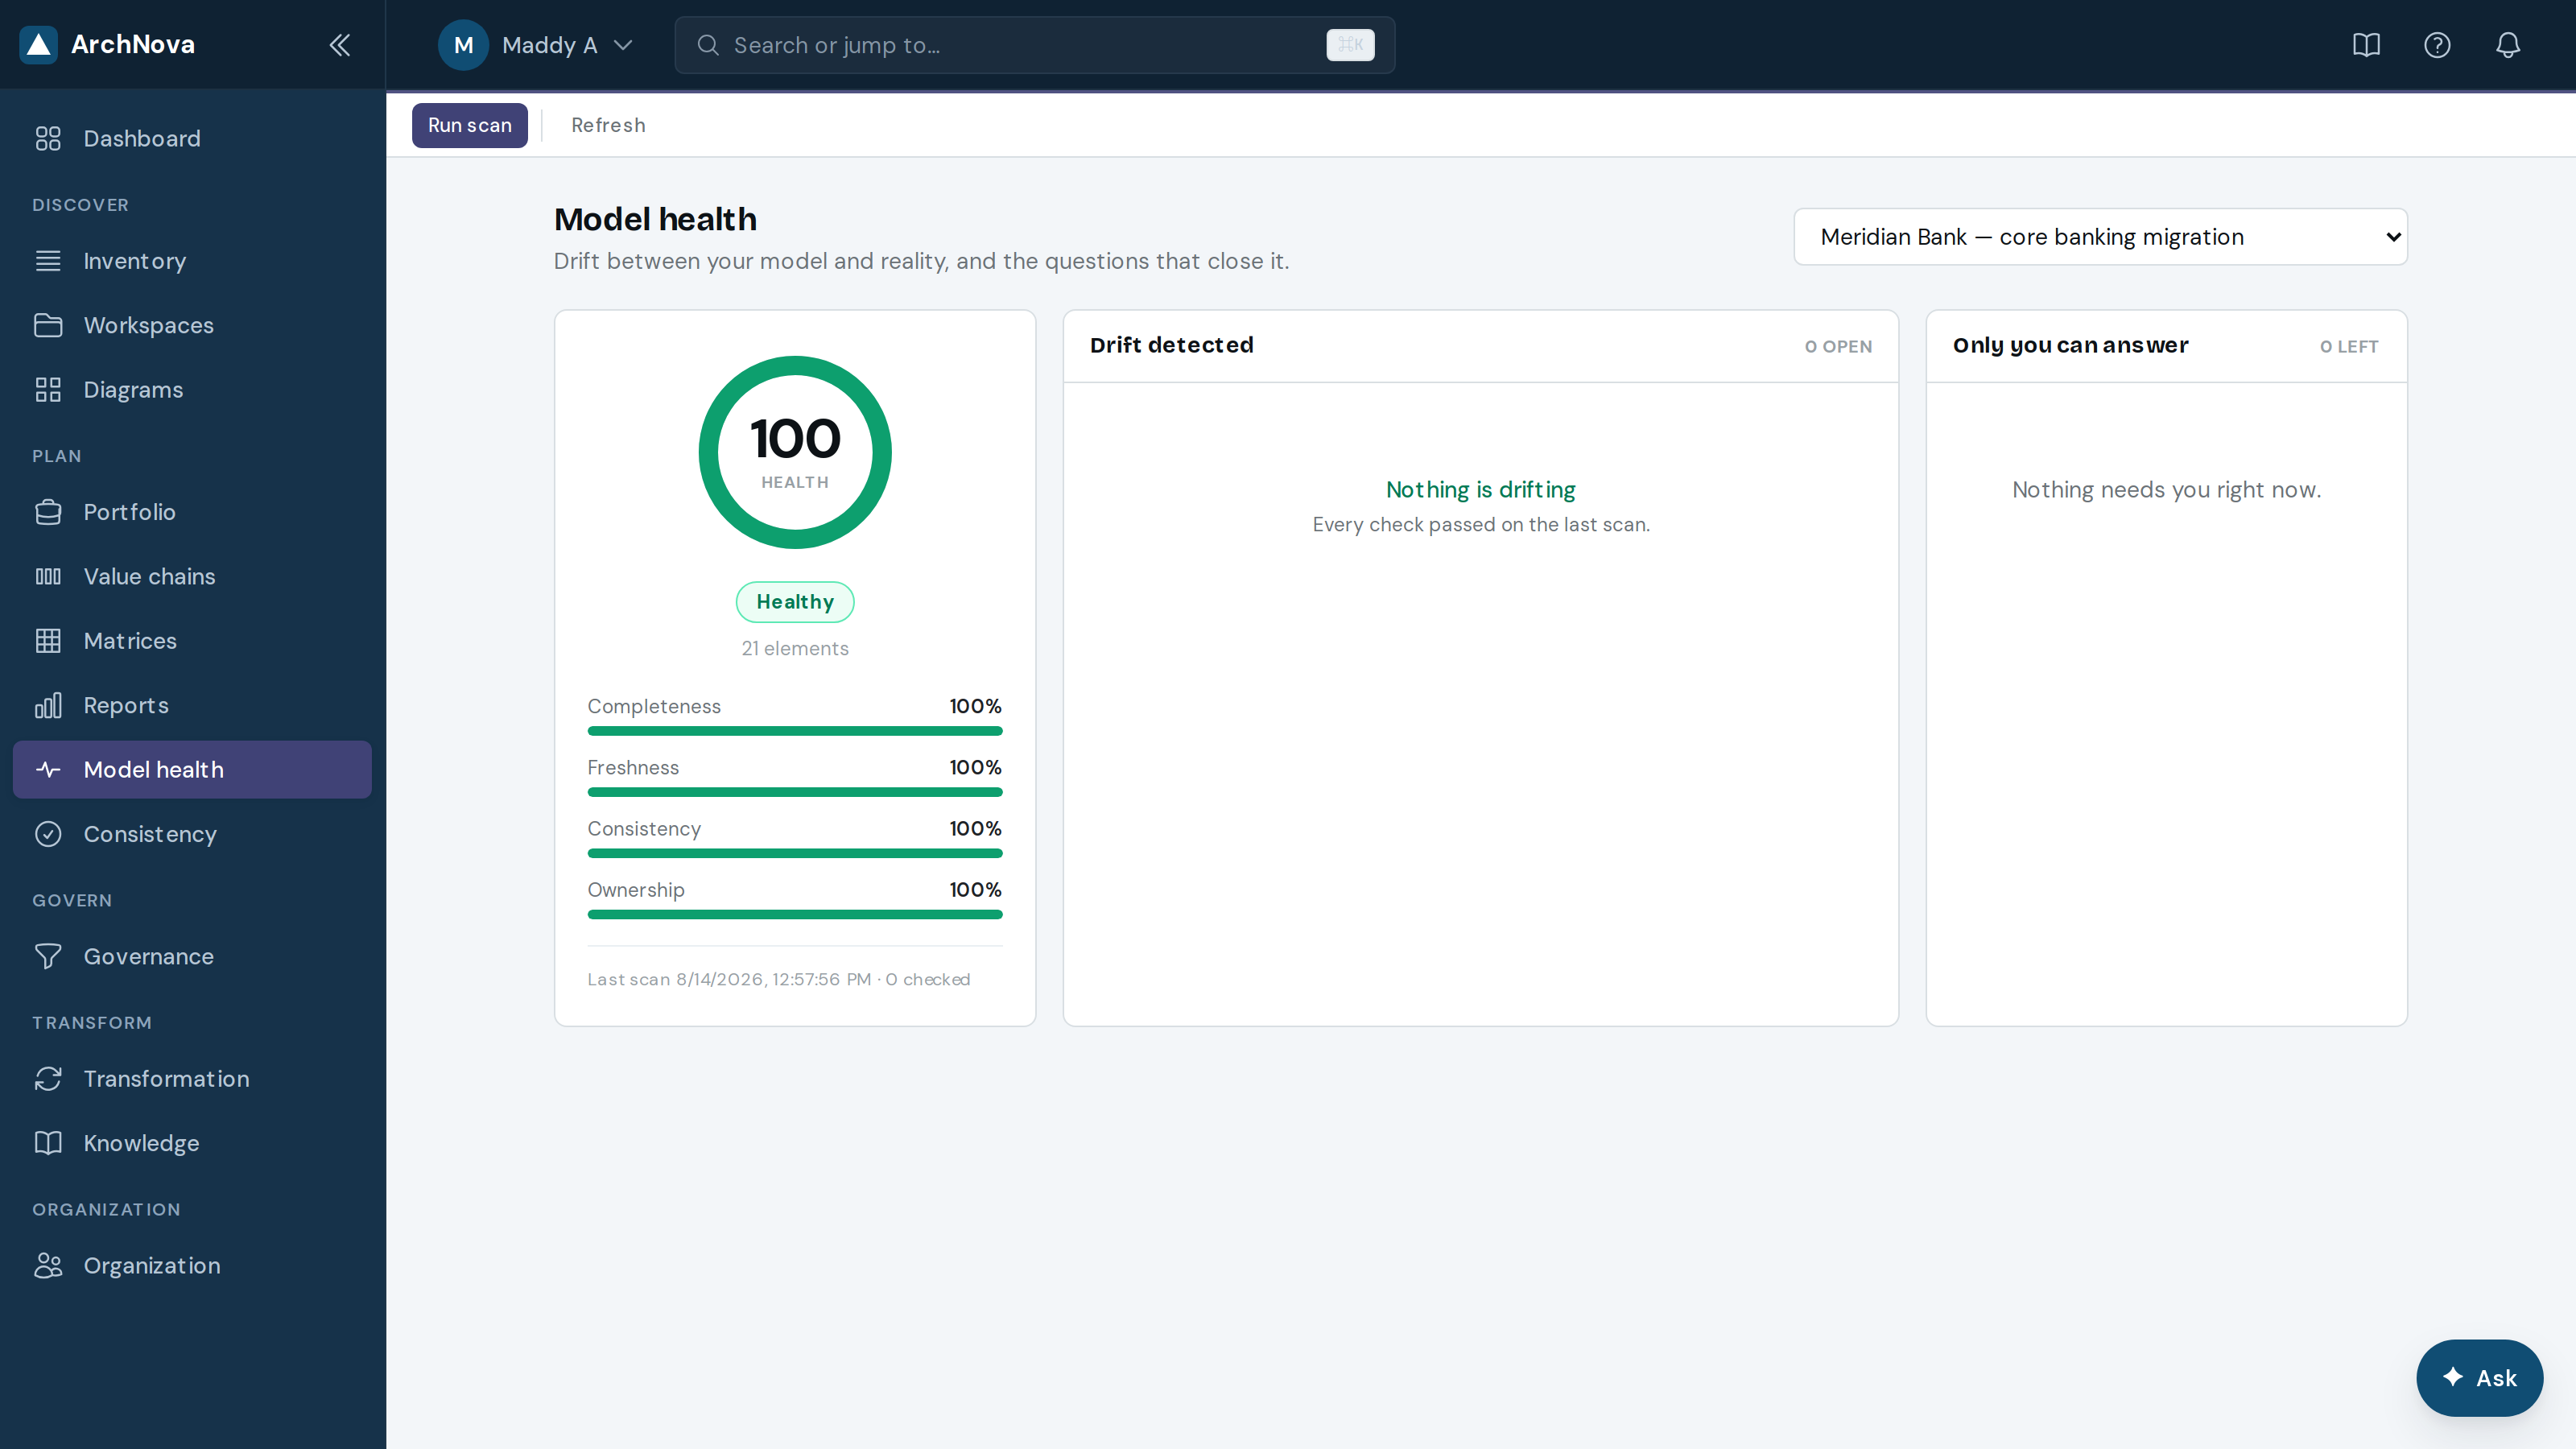
- Choose the workspace and select Run scan.
- Read the four sub-scores; the lowest one tells you where to spend the next hour.
- Re-scan after a bulk edit to confirm you improved things rather than moved the problem.
20Consistency
The consistency check is deterministic — no AI involved. It walks the model looking for contradictions a human would eventually trip over.
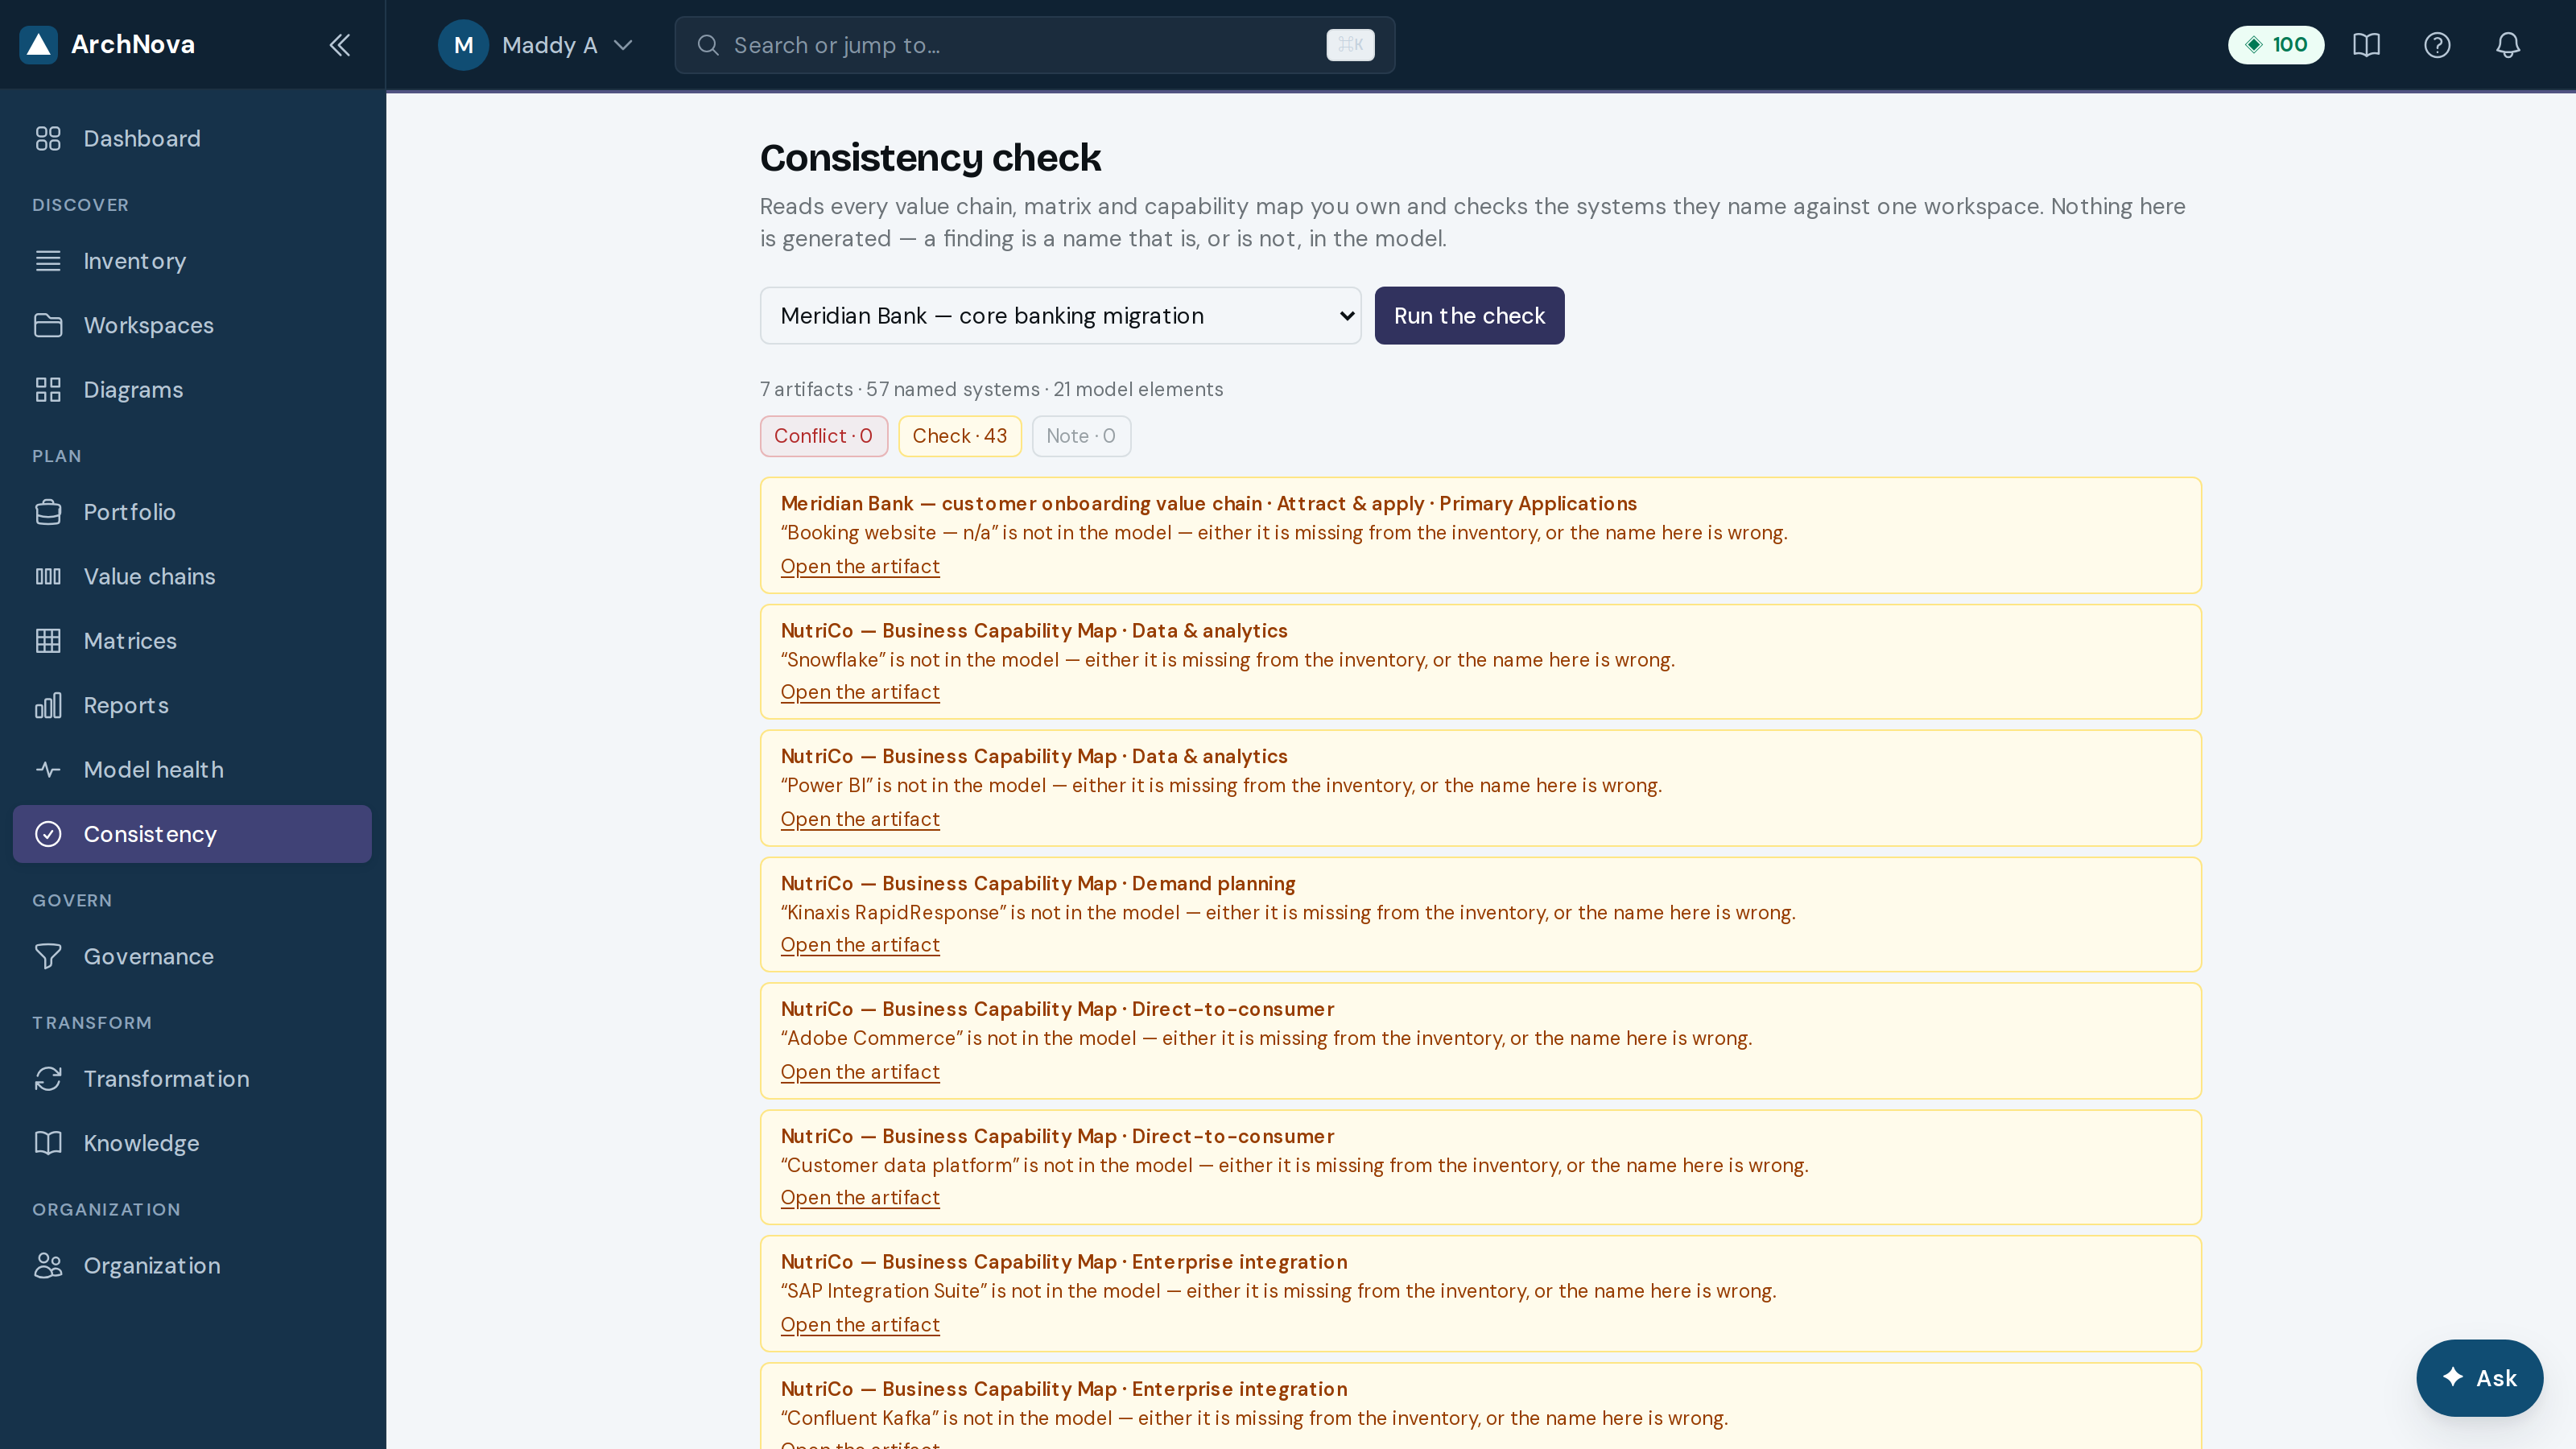
It catches things like an application marked end-of-life that a live process still depends on, capabilities with no realising system, relationships pointing at deleted elements, and elements whose zone contradicts their type.
- Choose a workspace and select Run the check.
- Work the list top down — each finding links to the element.
- Re-run to confirm. A clean run is a reasonable gate before publishing a model to stakeholders.
21Reports
Reports turns the model into something you can hand over — board packs, architecture reports, or a raw export for another tool.
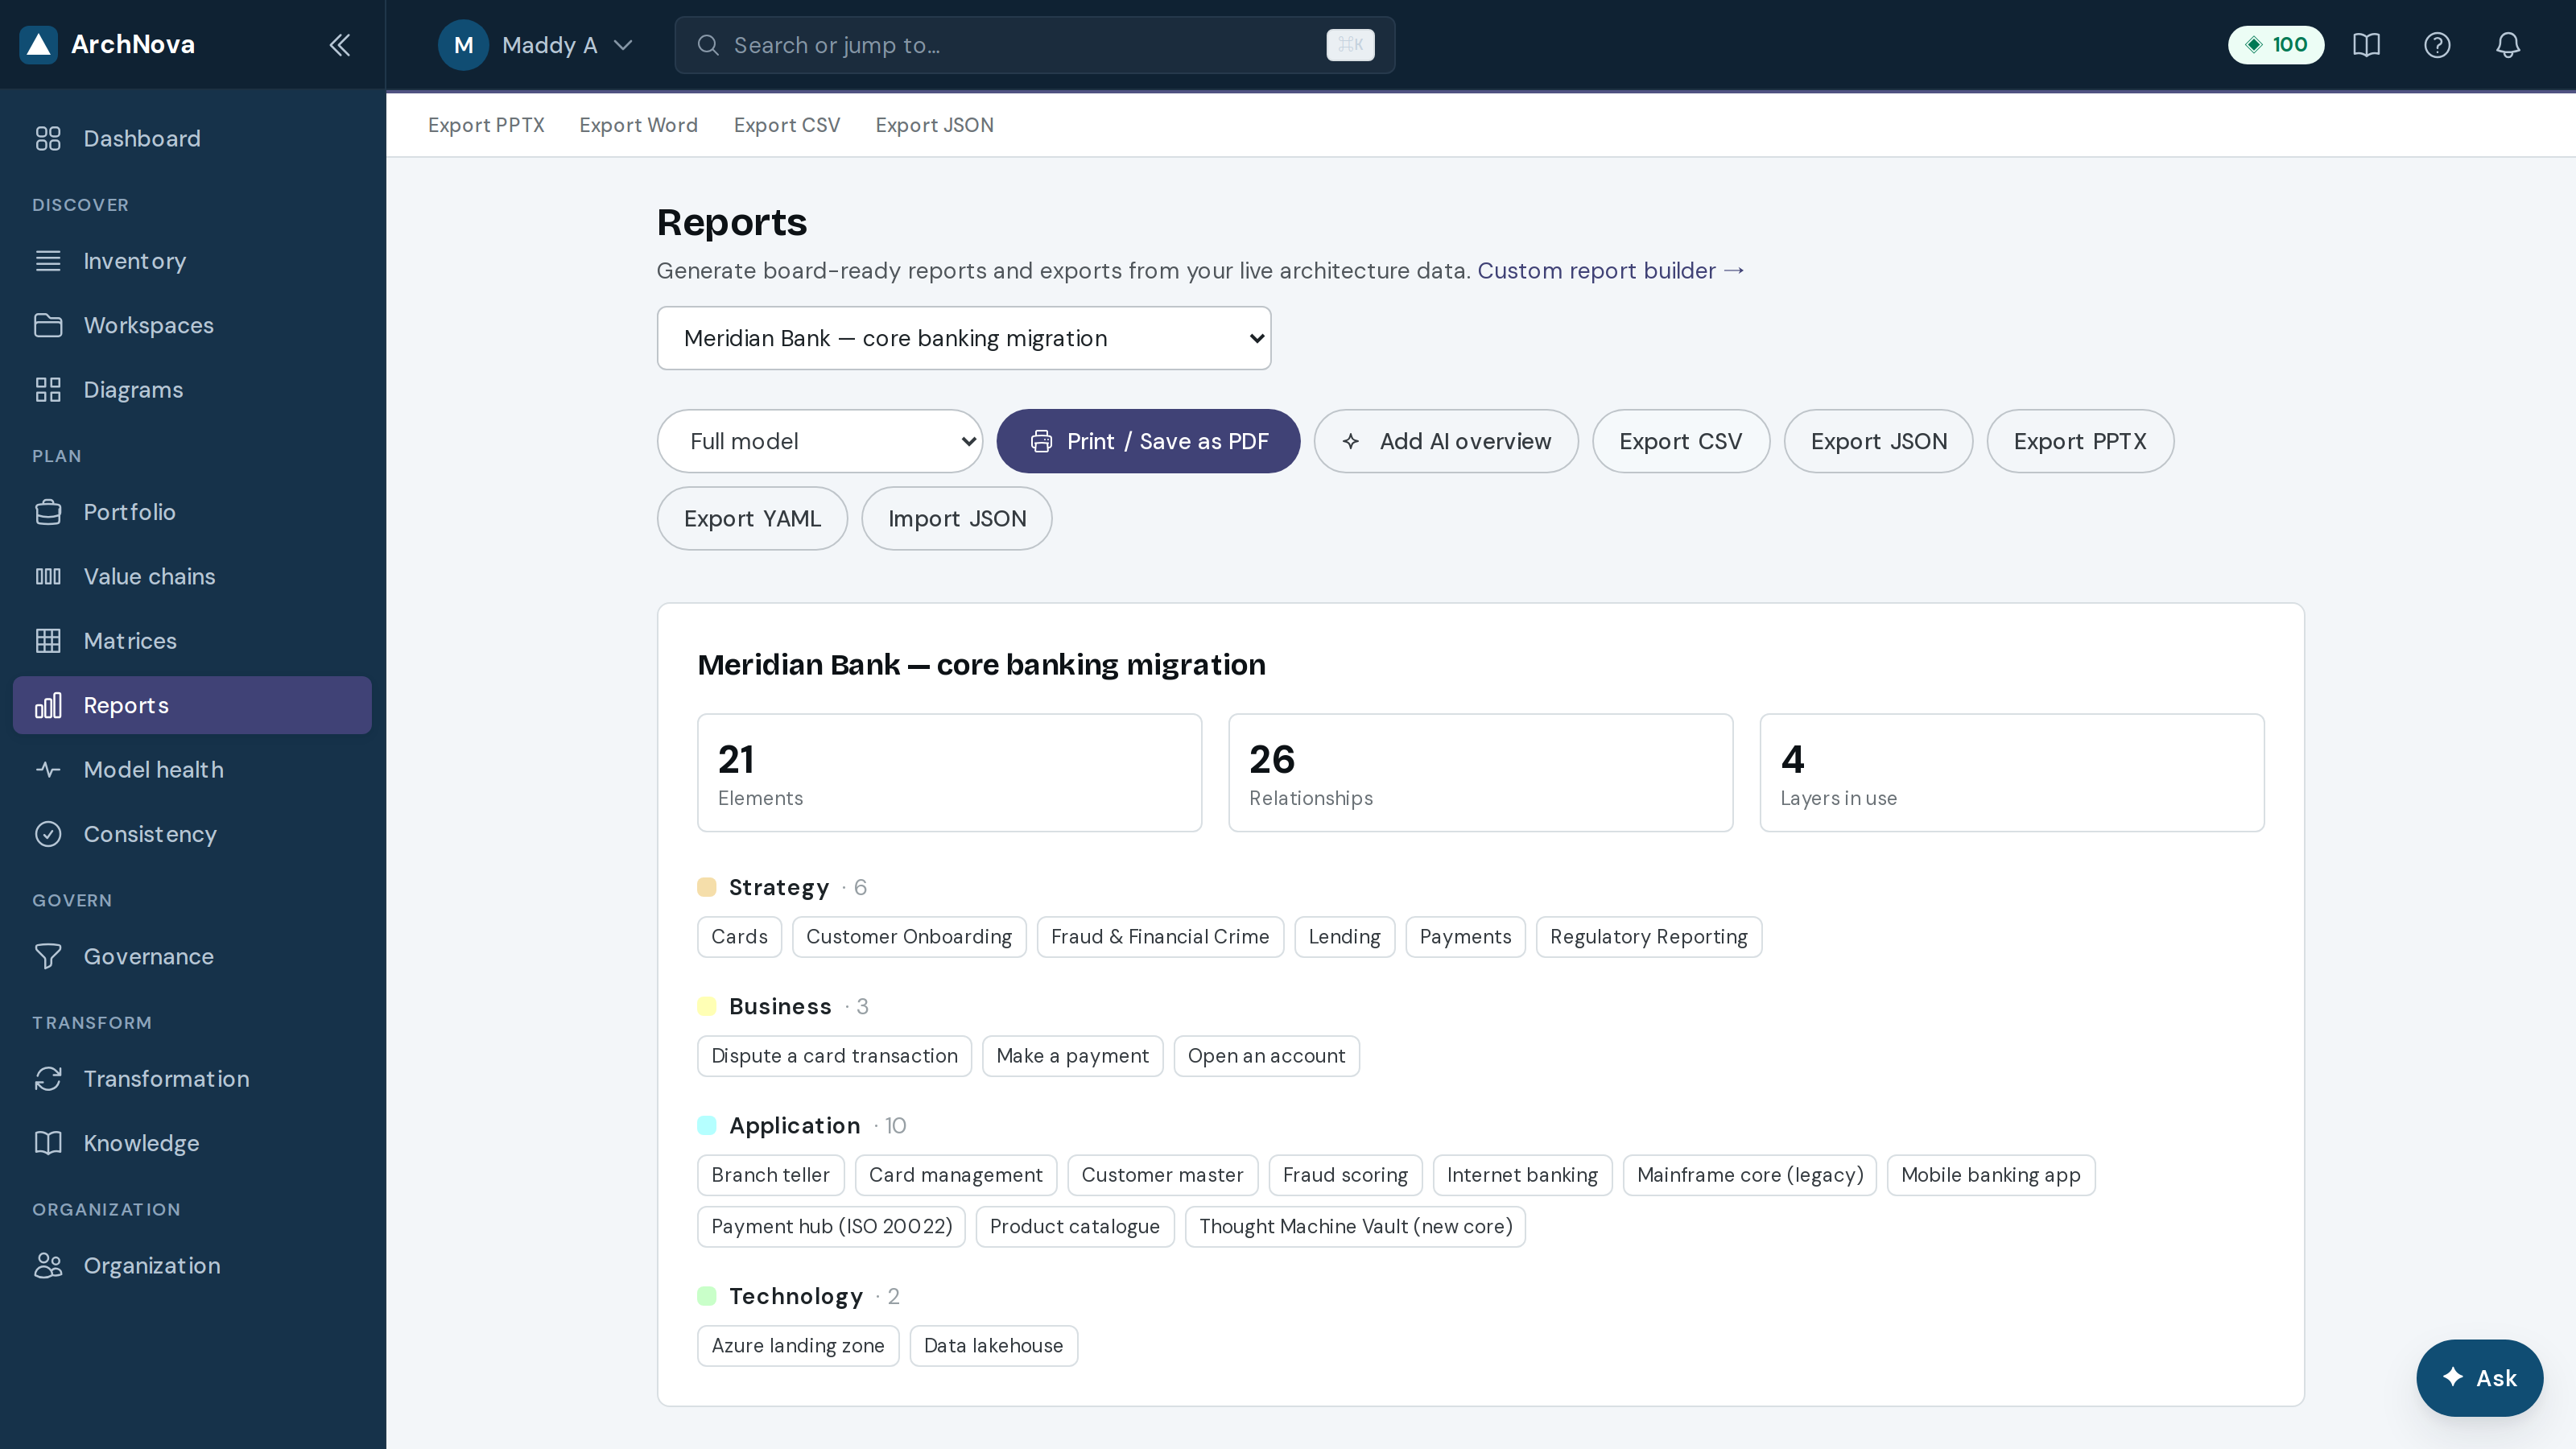
- Choose a report template, or build a custom one by selecting the sections you want.
- Preview it, then Print / Save as PDF or export to PPTX for a deck.
- Export CSV / JSON / YAML / XML hands the underlying data to another system.
- Scheduled delivery emails a report on a recurring basis, so the pack builds itself.
Keeping decisions honest
Governance is one module with four tabs: the decisions you have made, the risks you carry, the changes waiting for sign-off, and how you score against a framework.
22Policies & decisions
Architecture decision records capture what you decided, why, and what you rejected — the institutional memory that stops the same argument recurring every year.
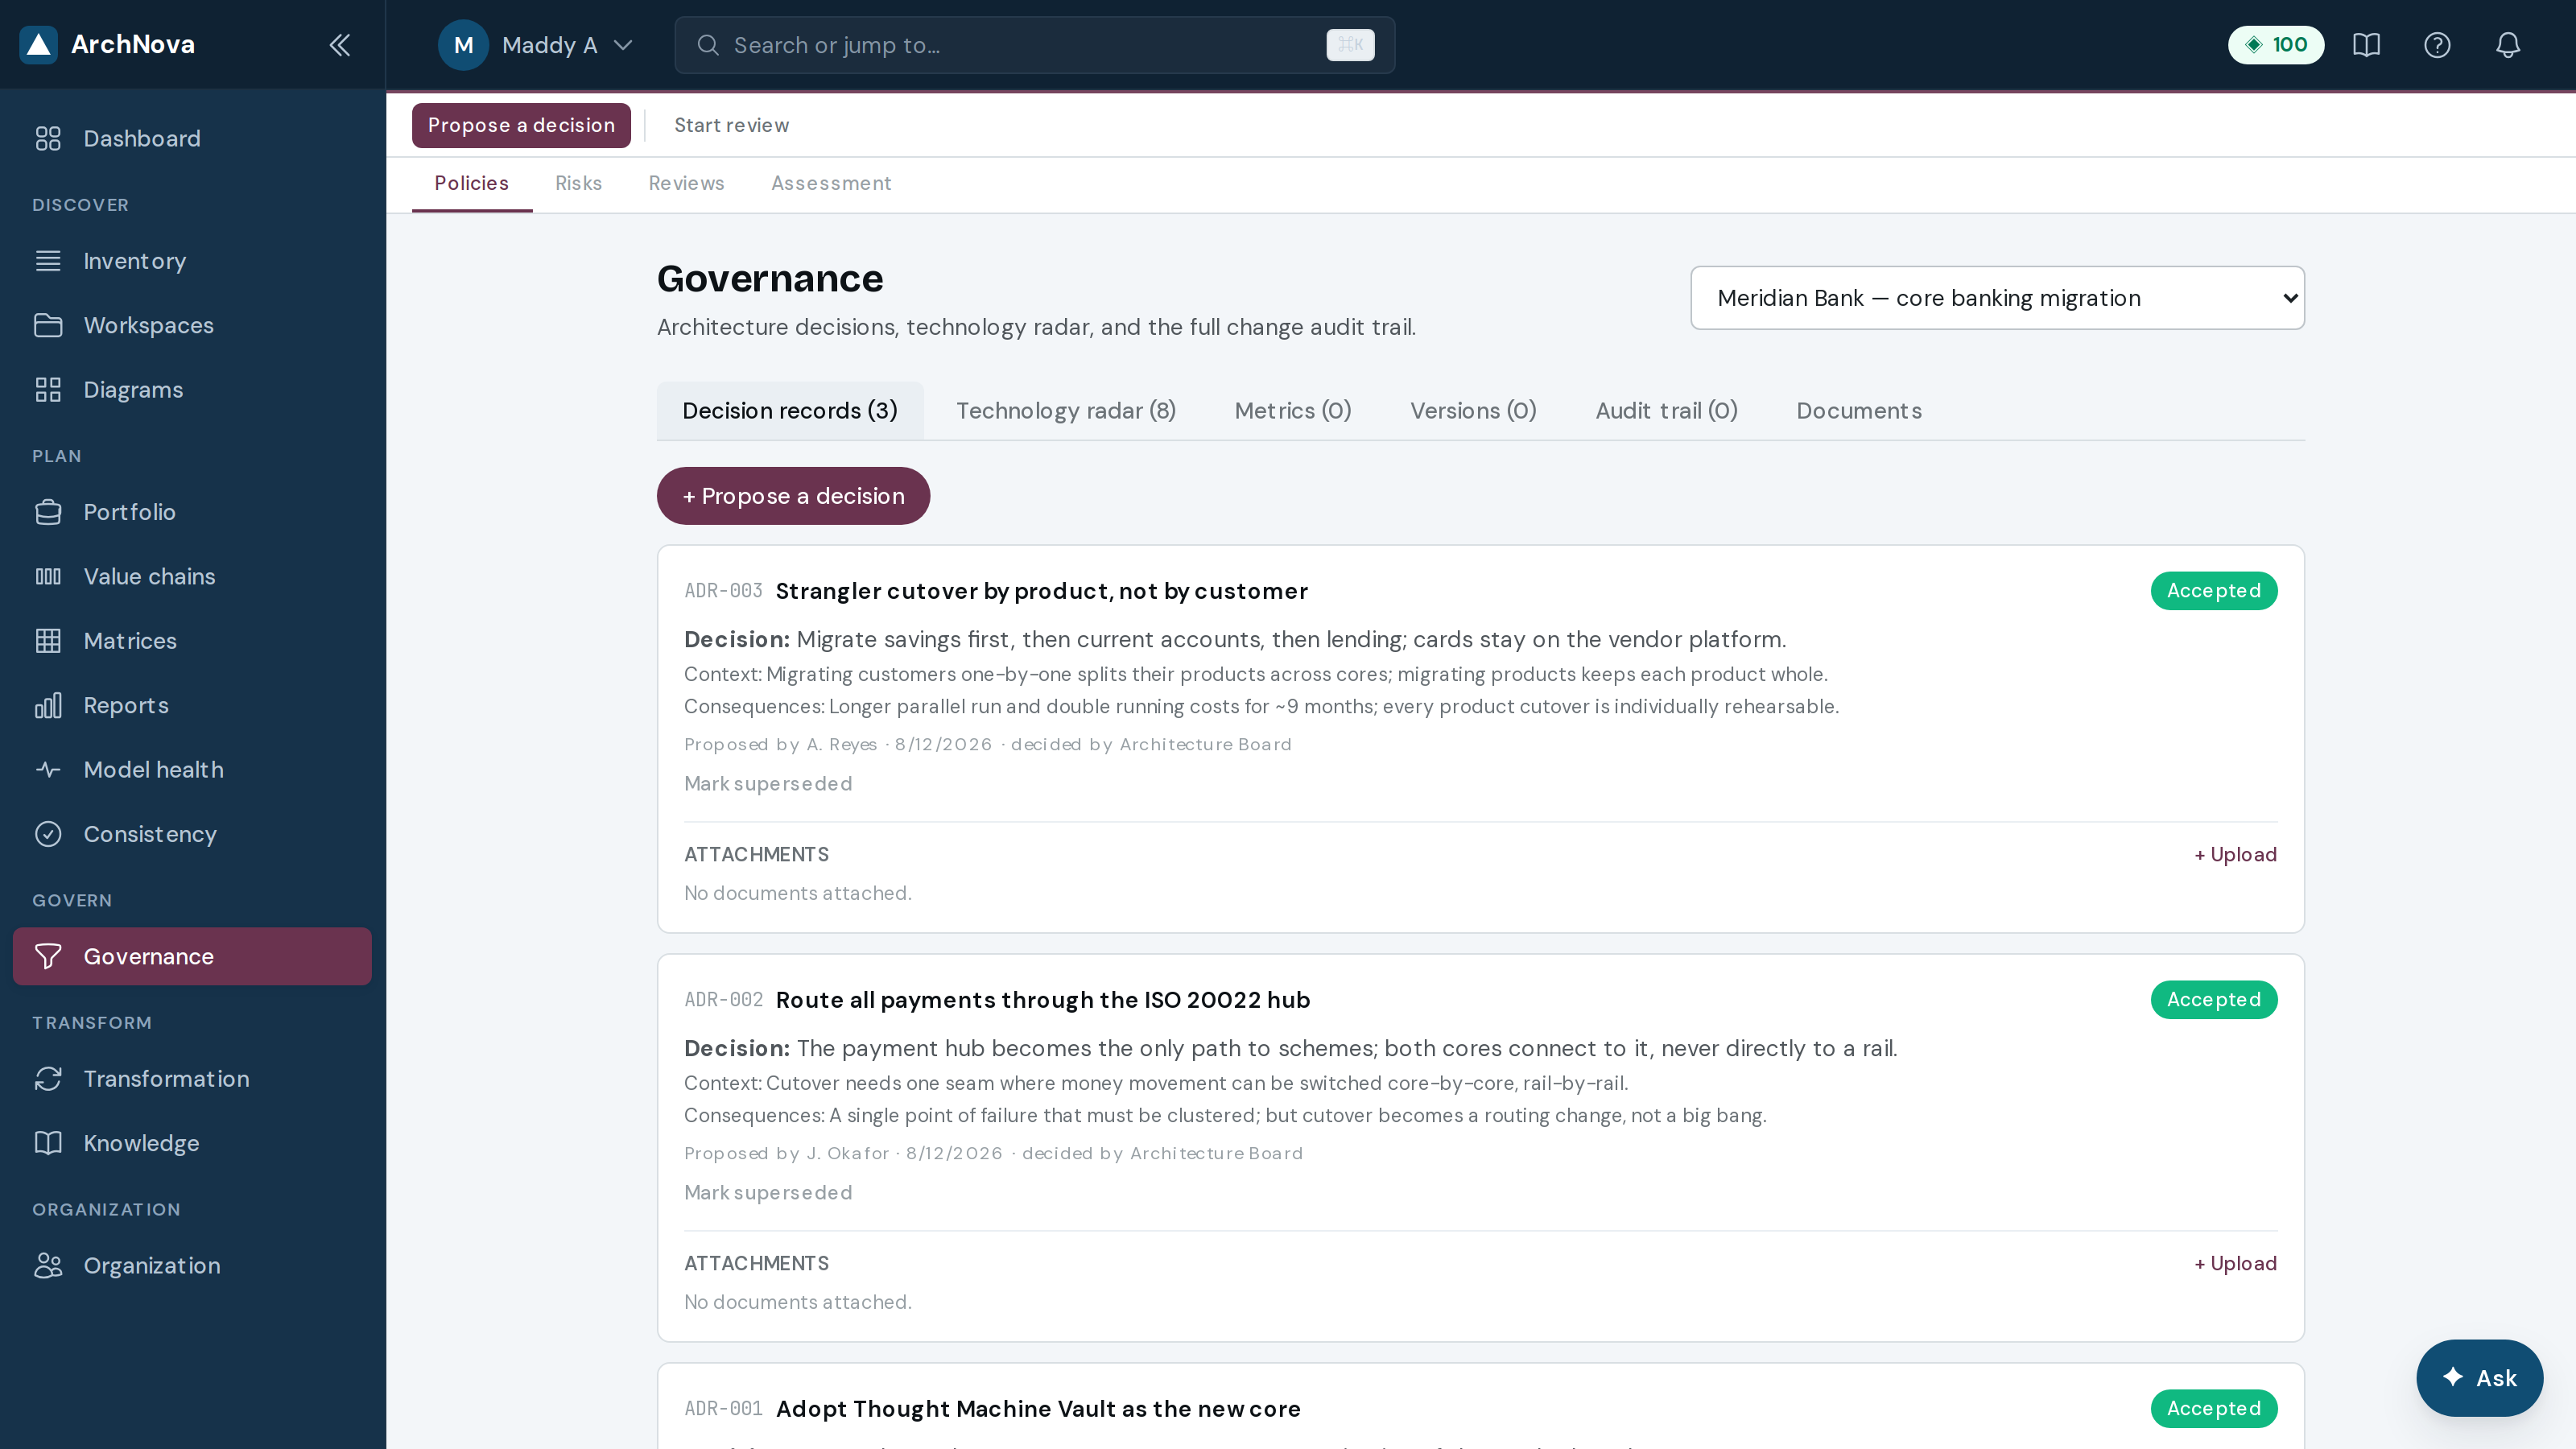
- Propose a decision, then record context, the decision itself, and the alternatives you rejected.
- Move it through proposed → accepted, or mark it rejected or superseded. A register where everything is accepted teaches nothing.
- Attach evidence, and link the decision to the elements it governs.
- The Technology radar tracks adopt / trial / assess / hold; the audit trail records who changed what.
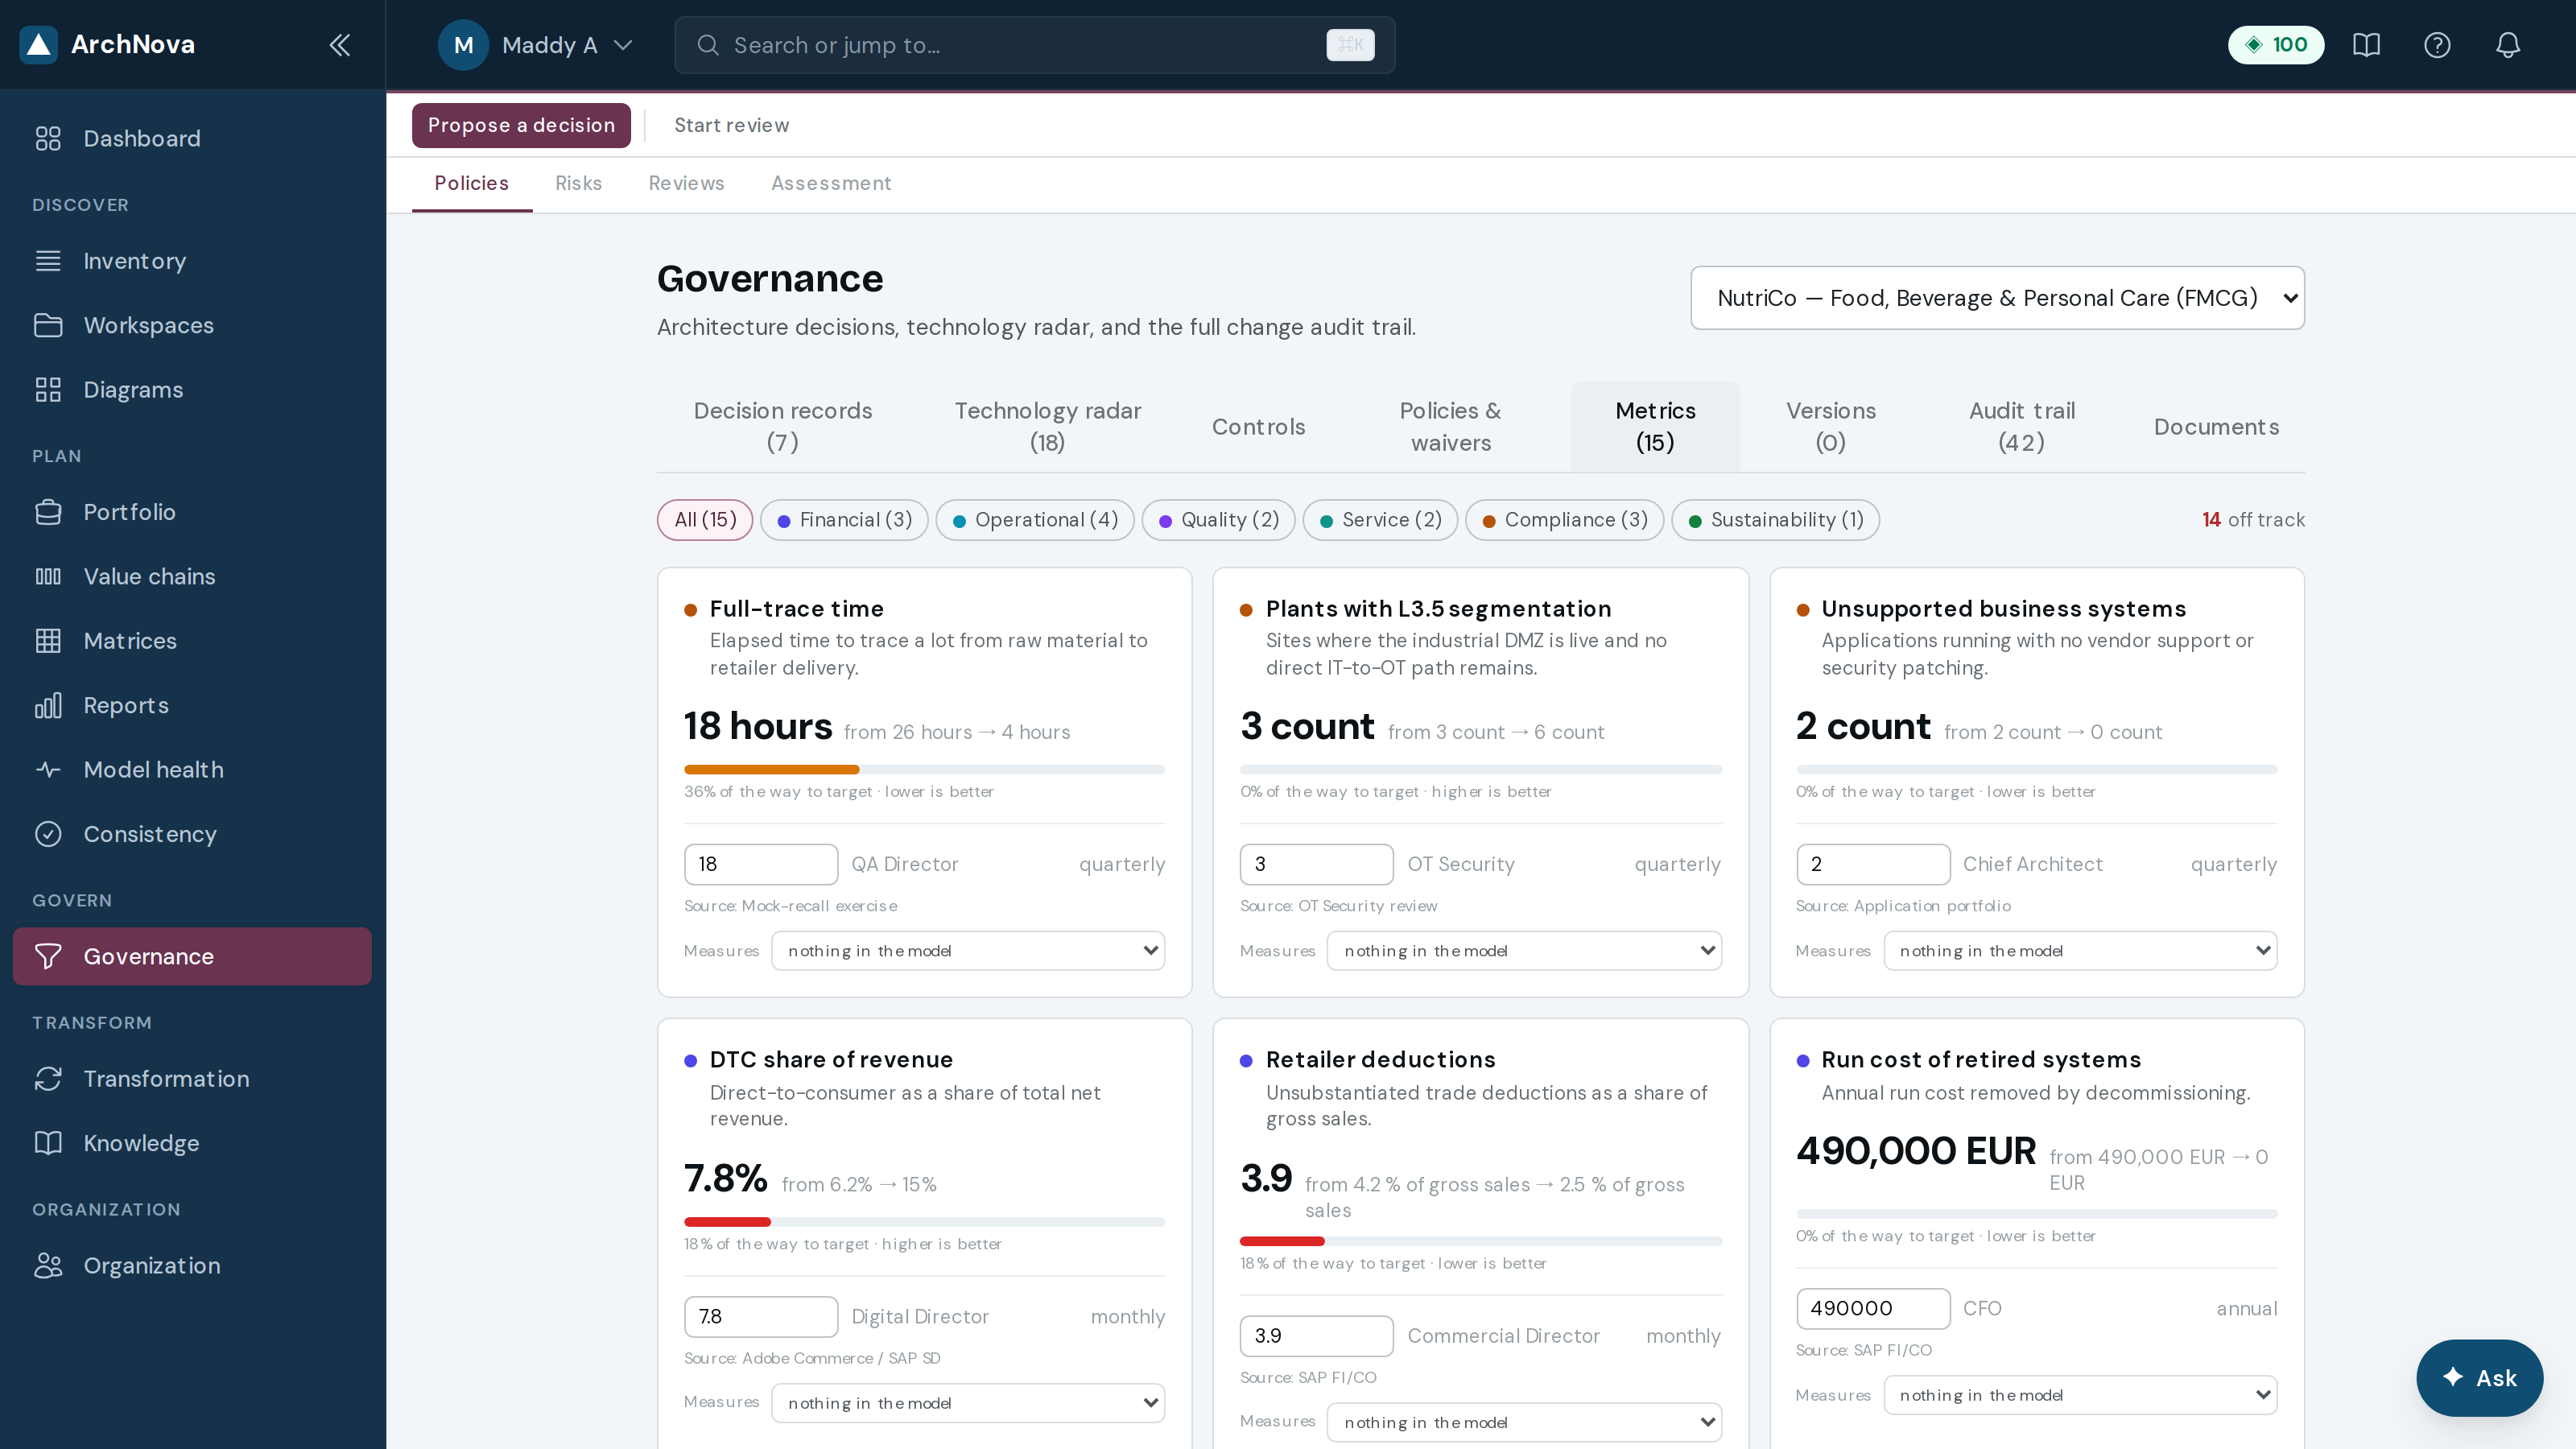
Metrics
The Metrics tab holds the numbers the business steers by — baseline, target, current and which way better points. Each metric can name the element it measures, which is what lets Traceability answer “which number proves this is working”.
23Risks
The risk register scores architecture risk on likelihood against impact, with an owner, a control and a mitigation for each one.
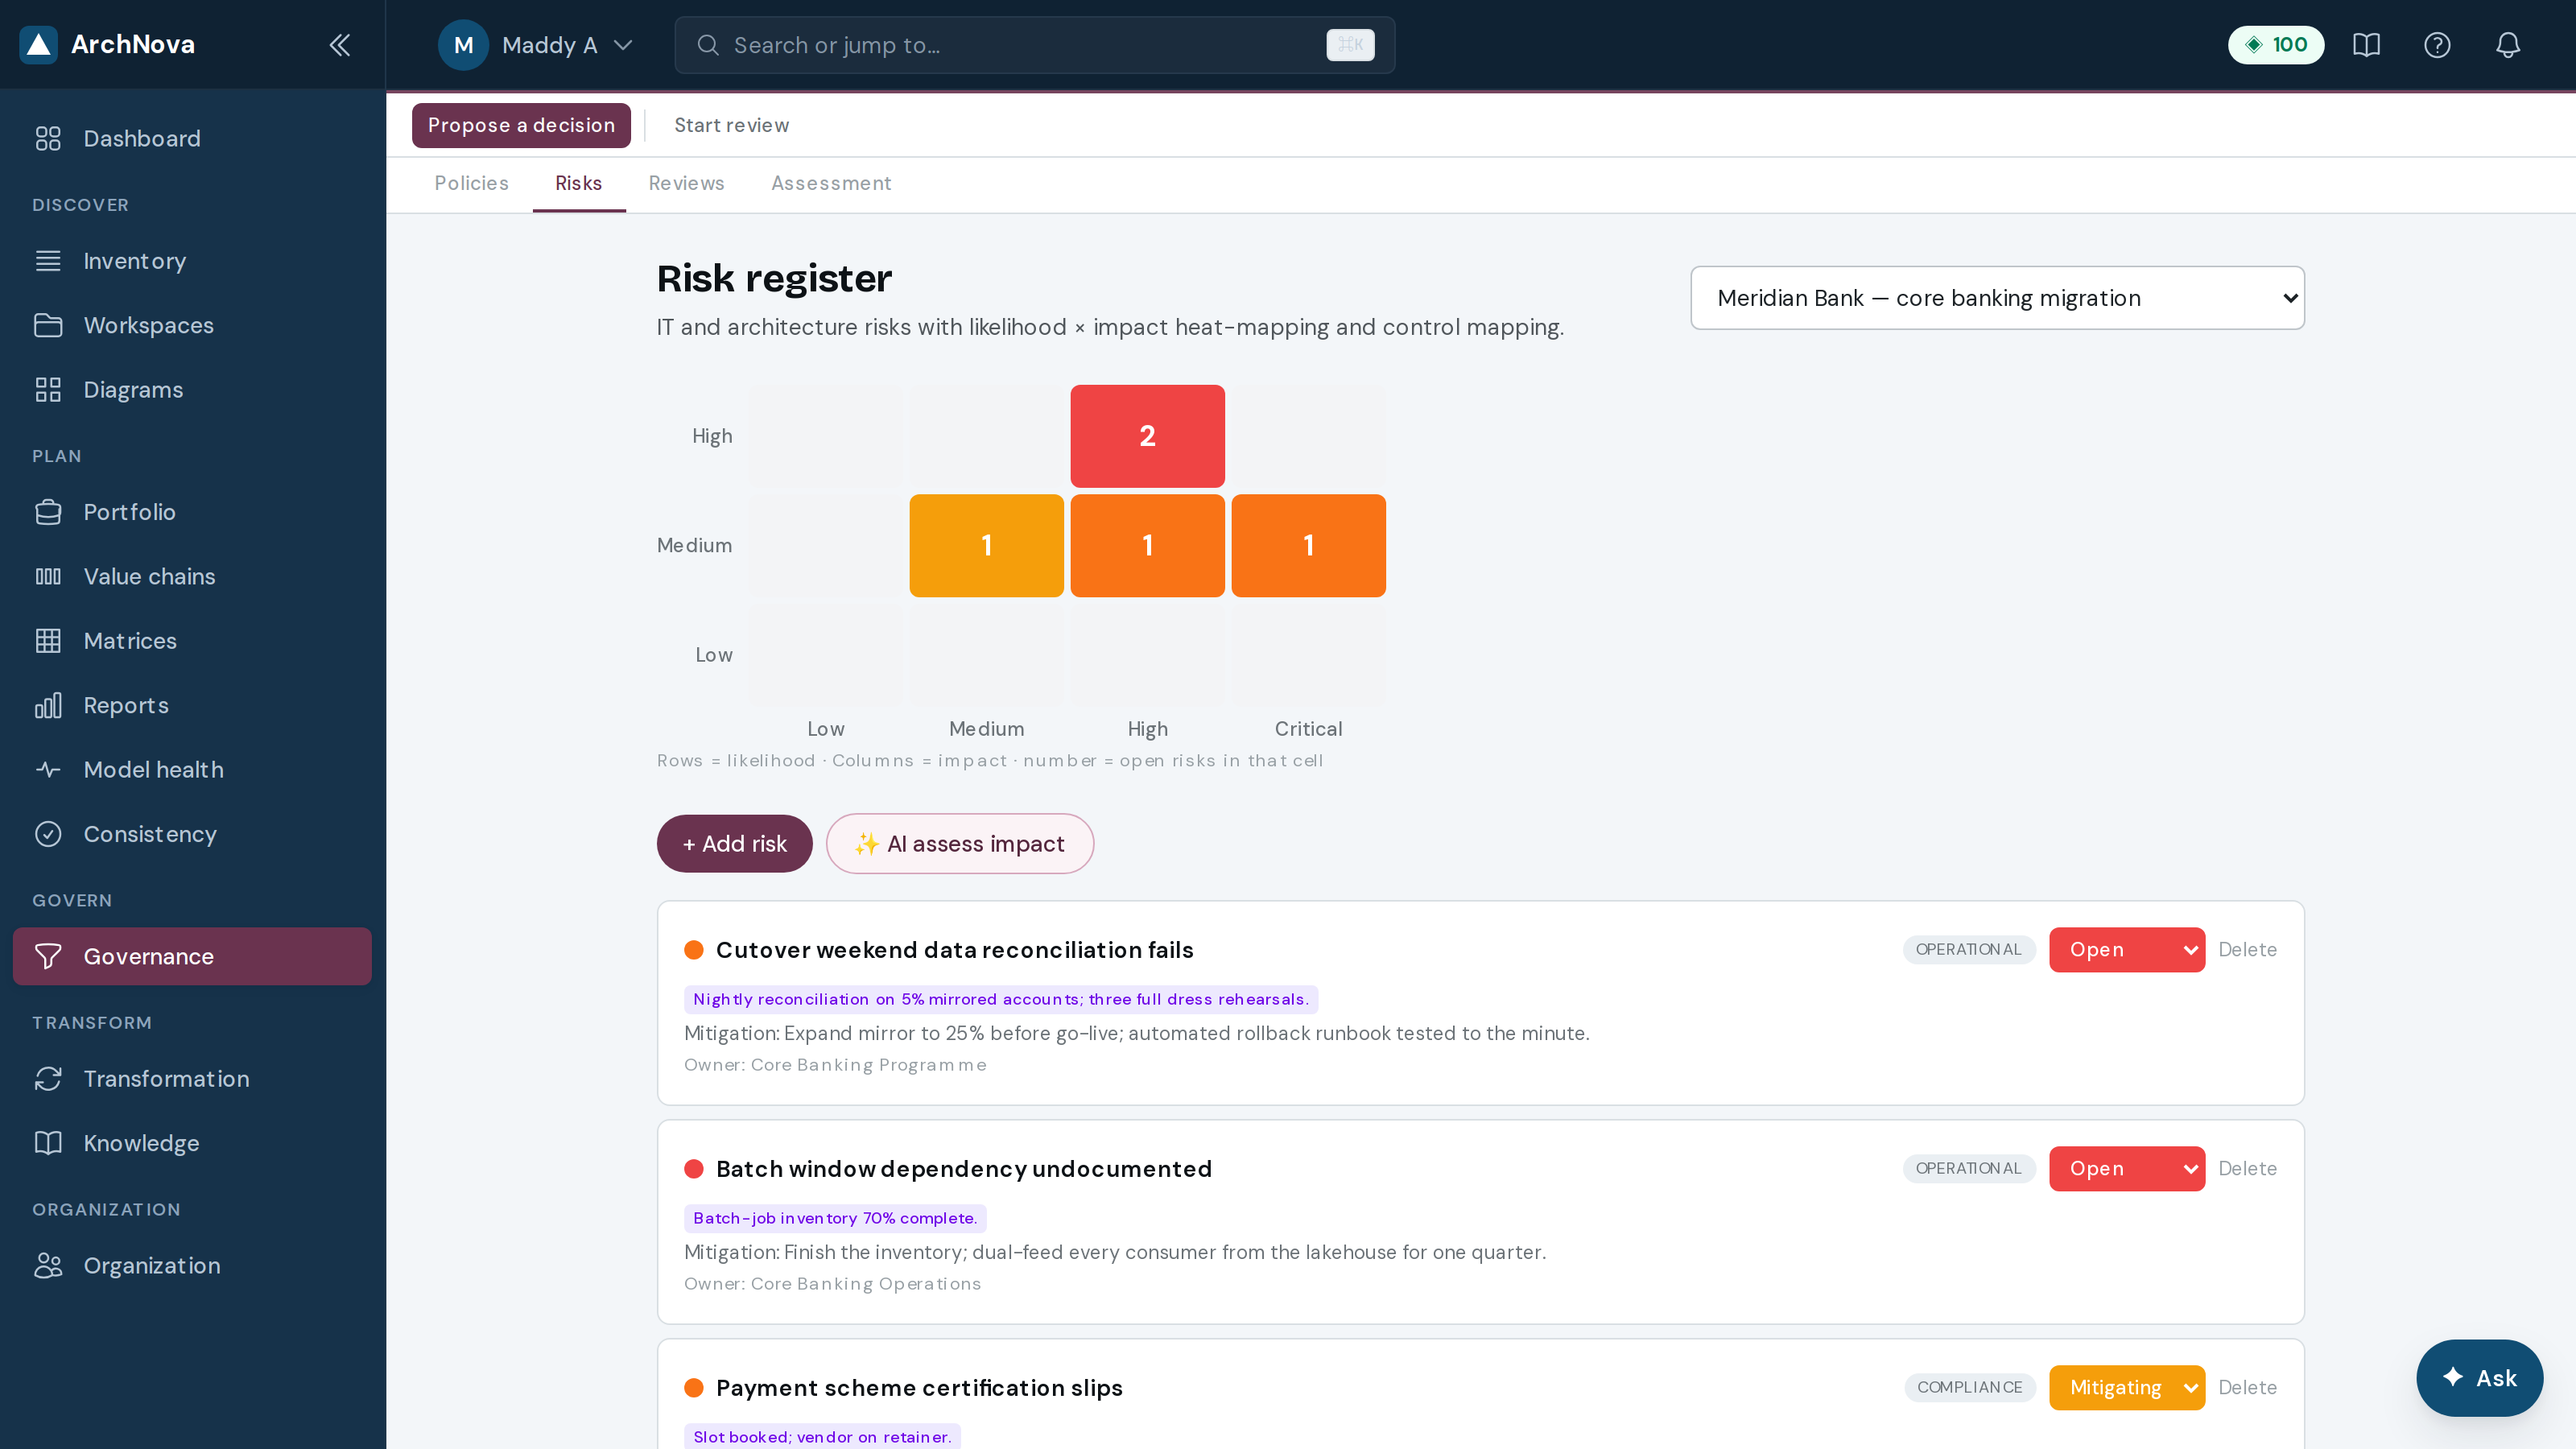
- Add risk and set category, likelihood and impact — the heat map positions it for you.
- Record the control already in place and the mitigation you plan; name an owner.
- Link the risk to the elements it threatens, so an impact analysis picks it up.
- Assess impact asks the AI to reason about knock-on effects across the model.AI
24Reviews
Reviews route a proposed model change through sign-off before it lands, so the model stays trustworthy when more than one person edits it.
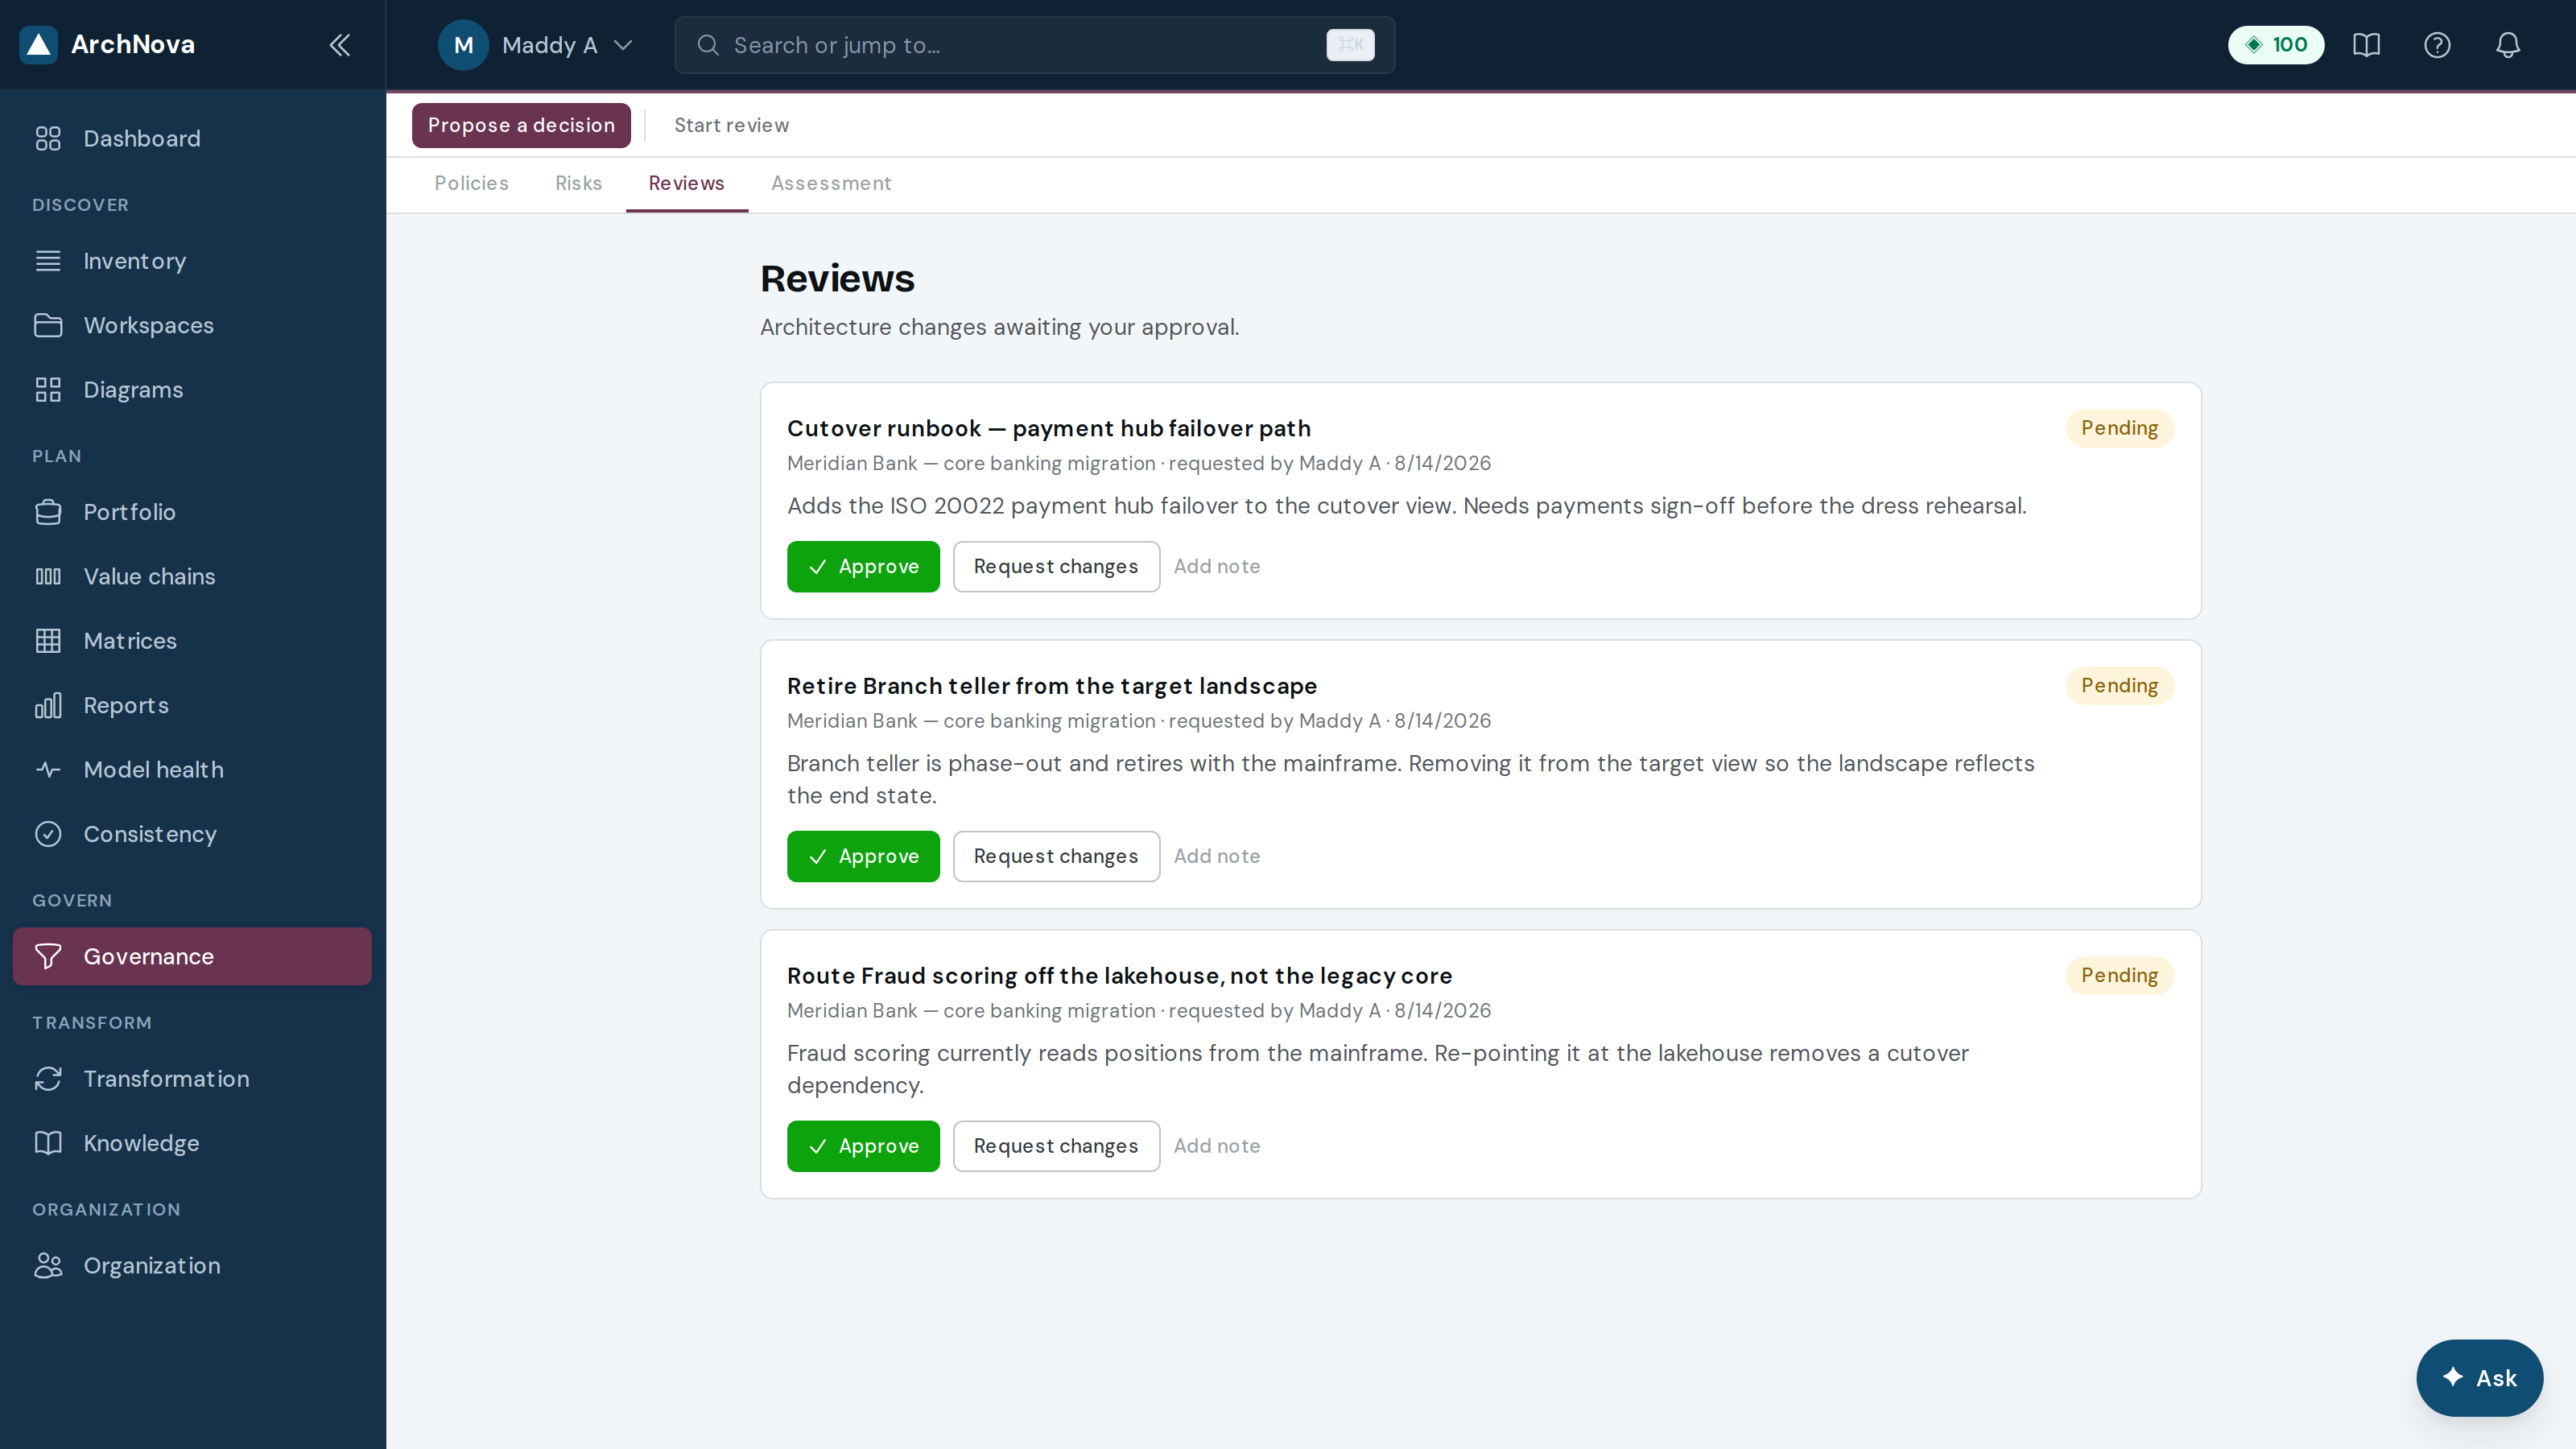
- From the canvas, use Collaborate → Review to raise a review on the current state.
- Write a note explaining why the change matters — the reviewer is usually not the person who drew it.
- A reviewer selects Approve or Request changes, with a decision note.
- The audit trail records who decided what and when.
25Security controls
A control catalogue mapped onto the elements it protects, so “are we covered?” has an answer you can point at.
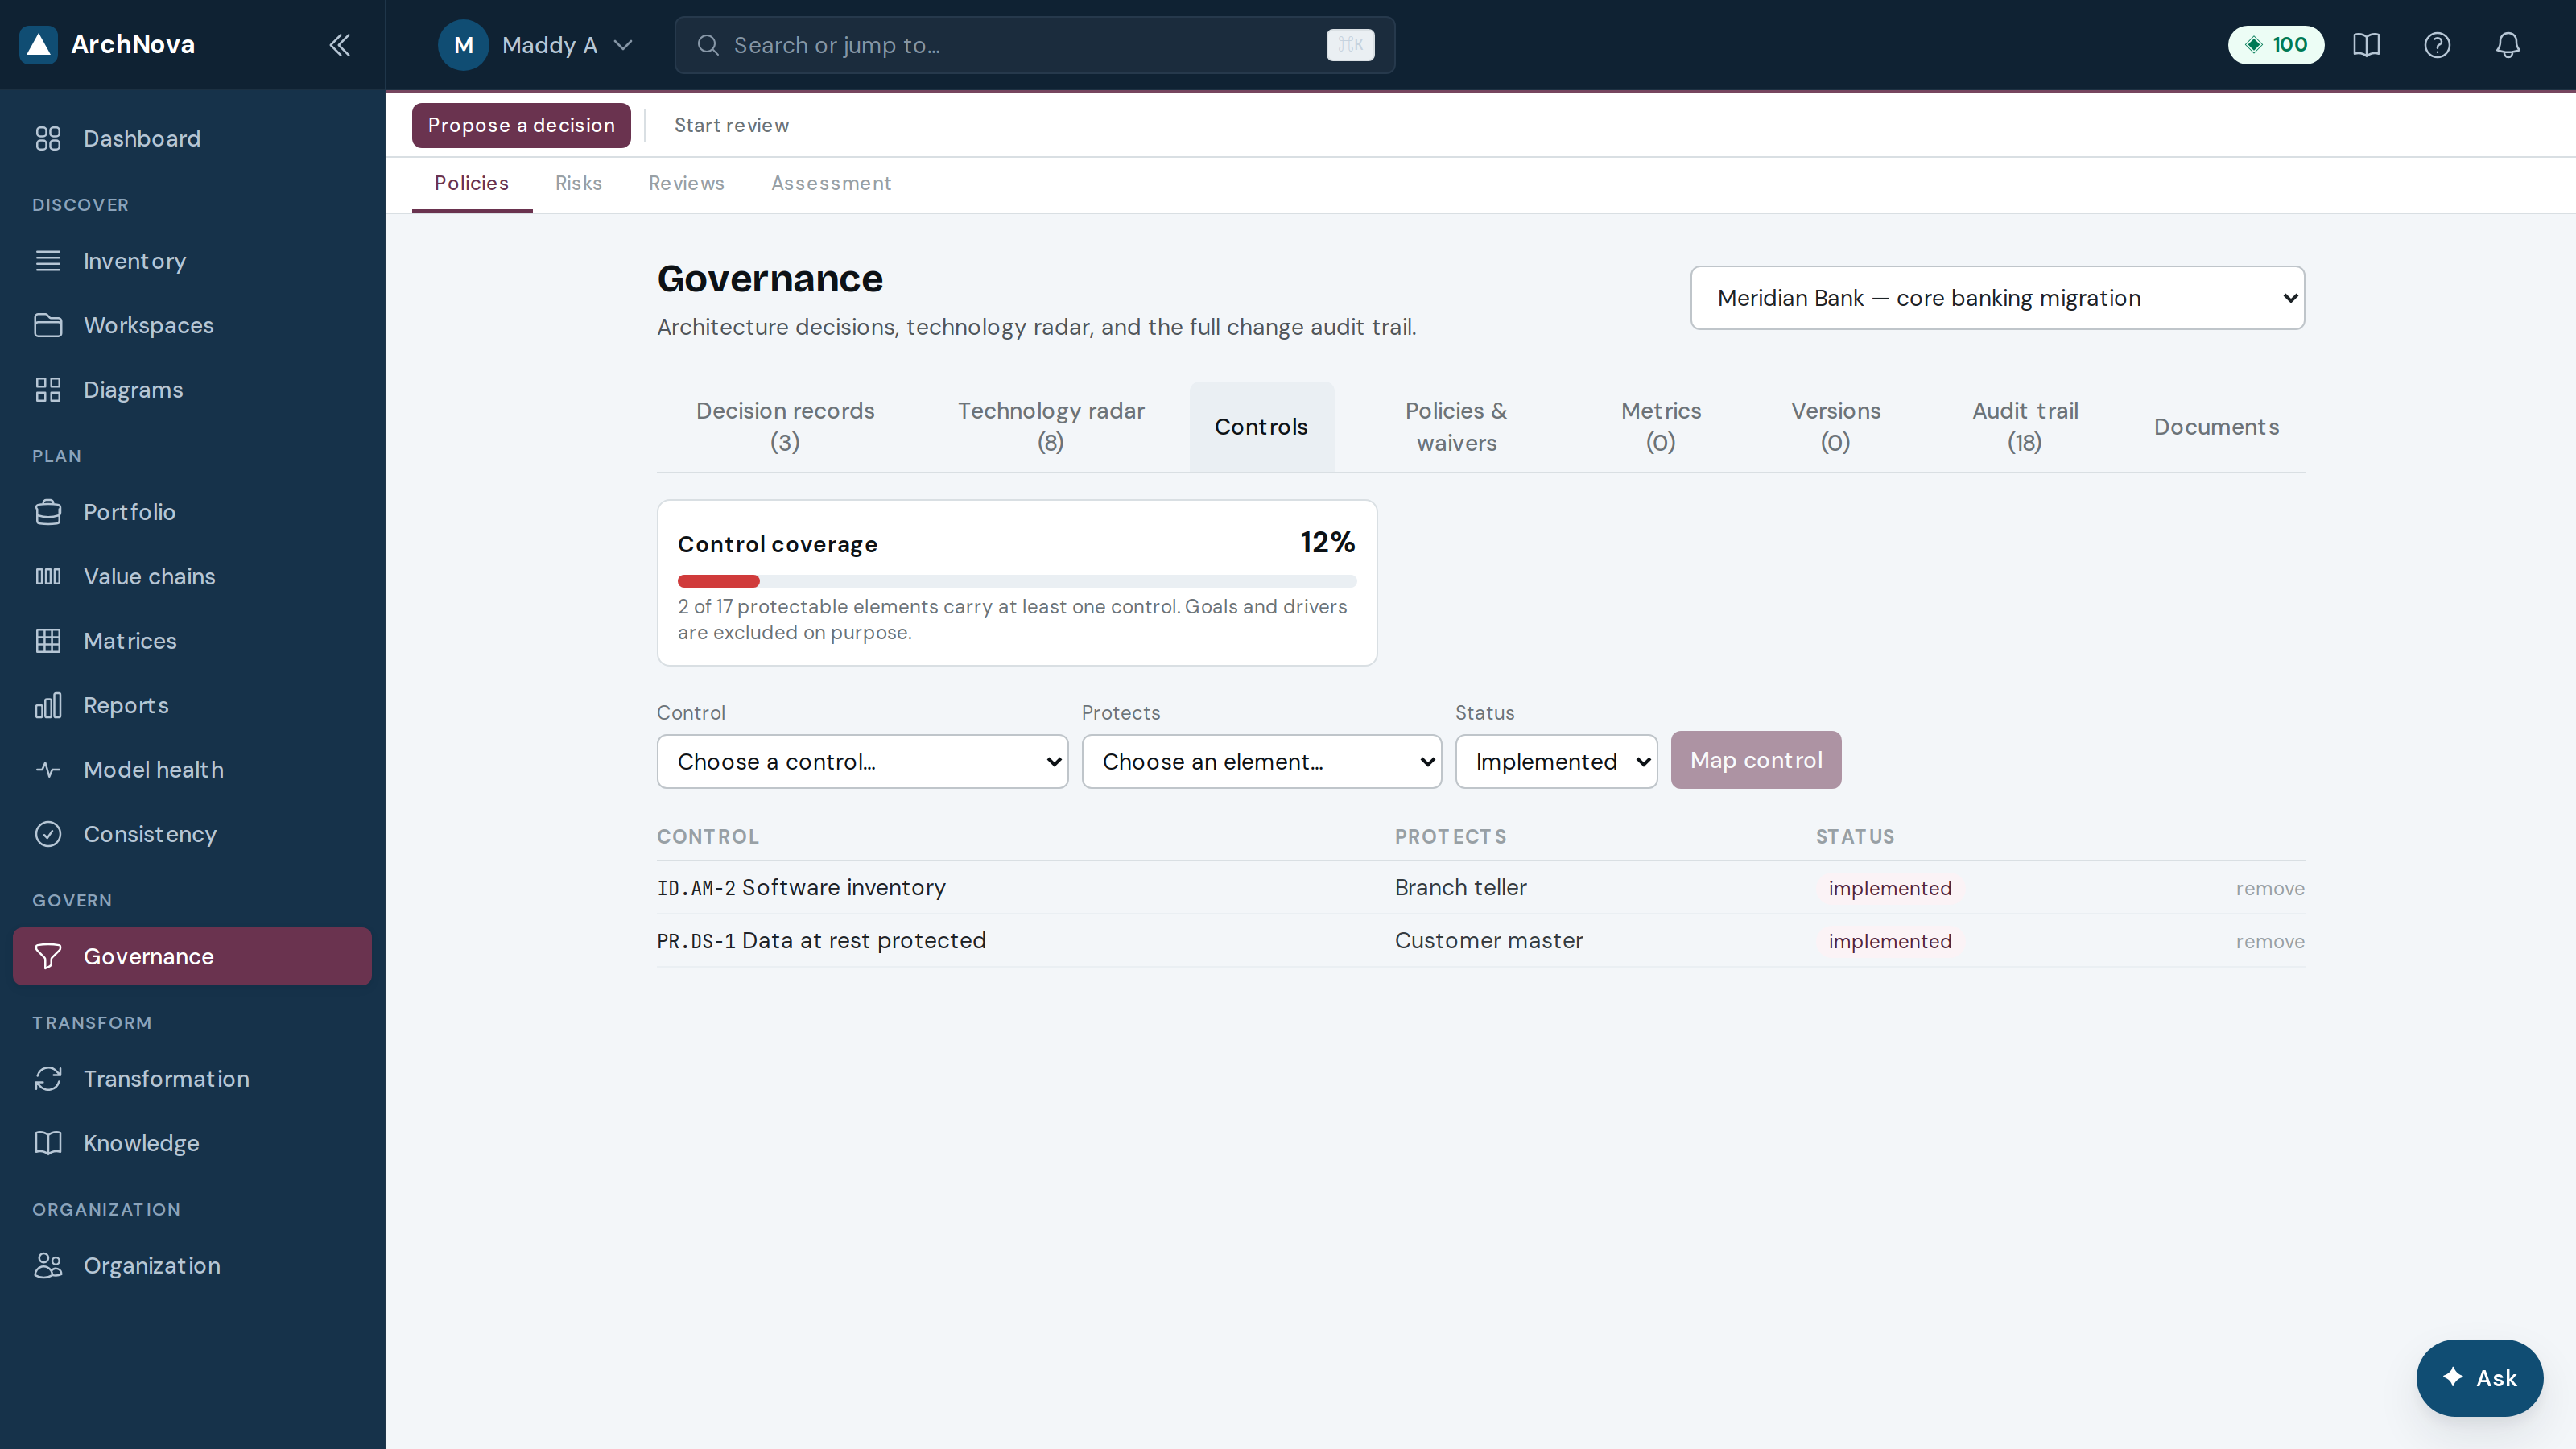
- Pick a control, the element it protects, and a status — planned, implemented or verified.
- Map control records it; coverage recalculates immediately.
- Coverage counts only protectable elements — applications, AI systems, technology and data. Goals and drivers are excluded, because counting them would flatter the number.
26Policies & waivers
Policies, standards and regulations as objects linked to the elements they govern — not paragraphs in a document nobody opens. Every exception carries an expiry.
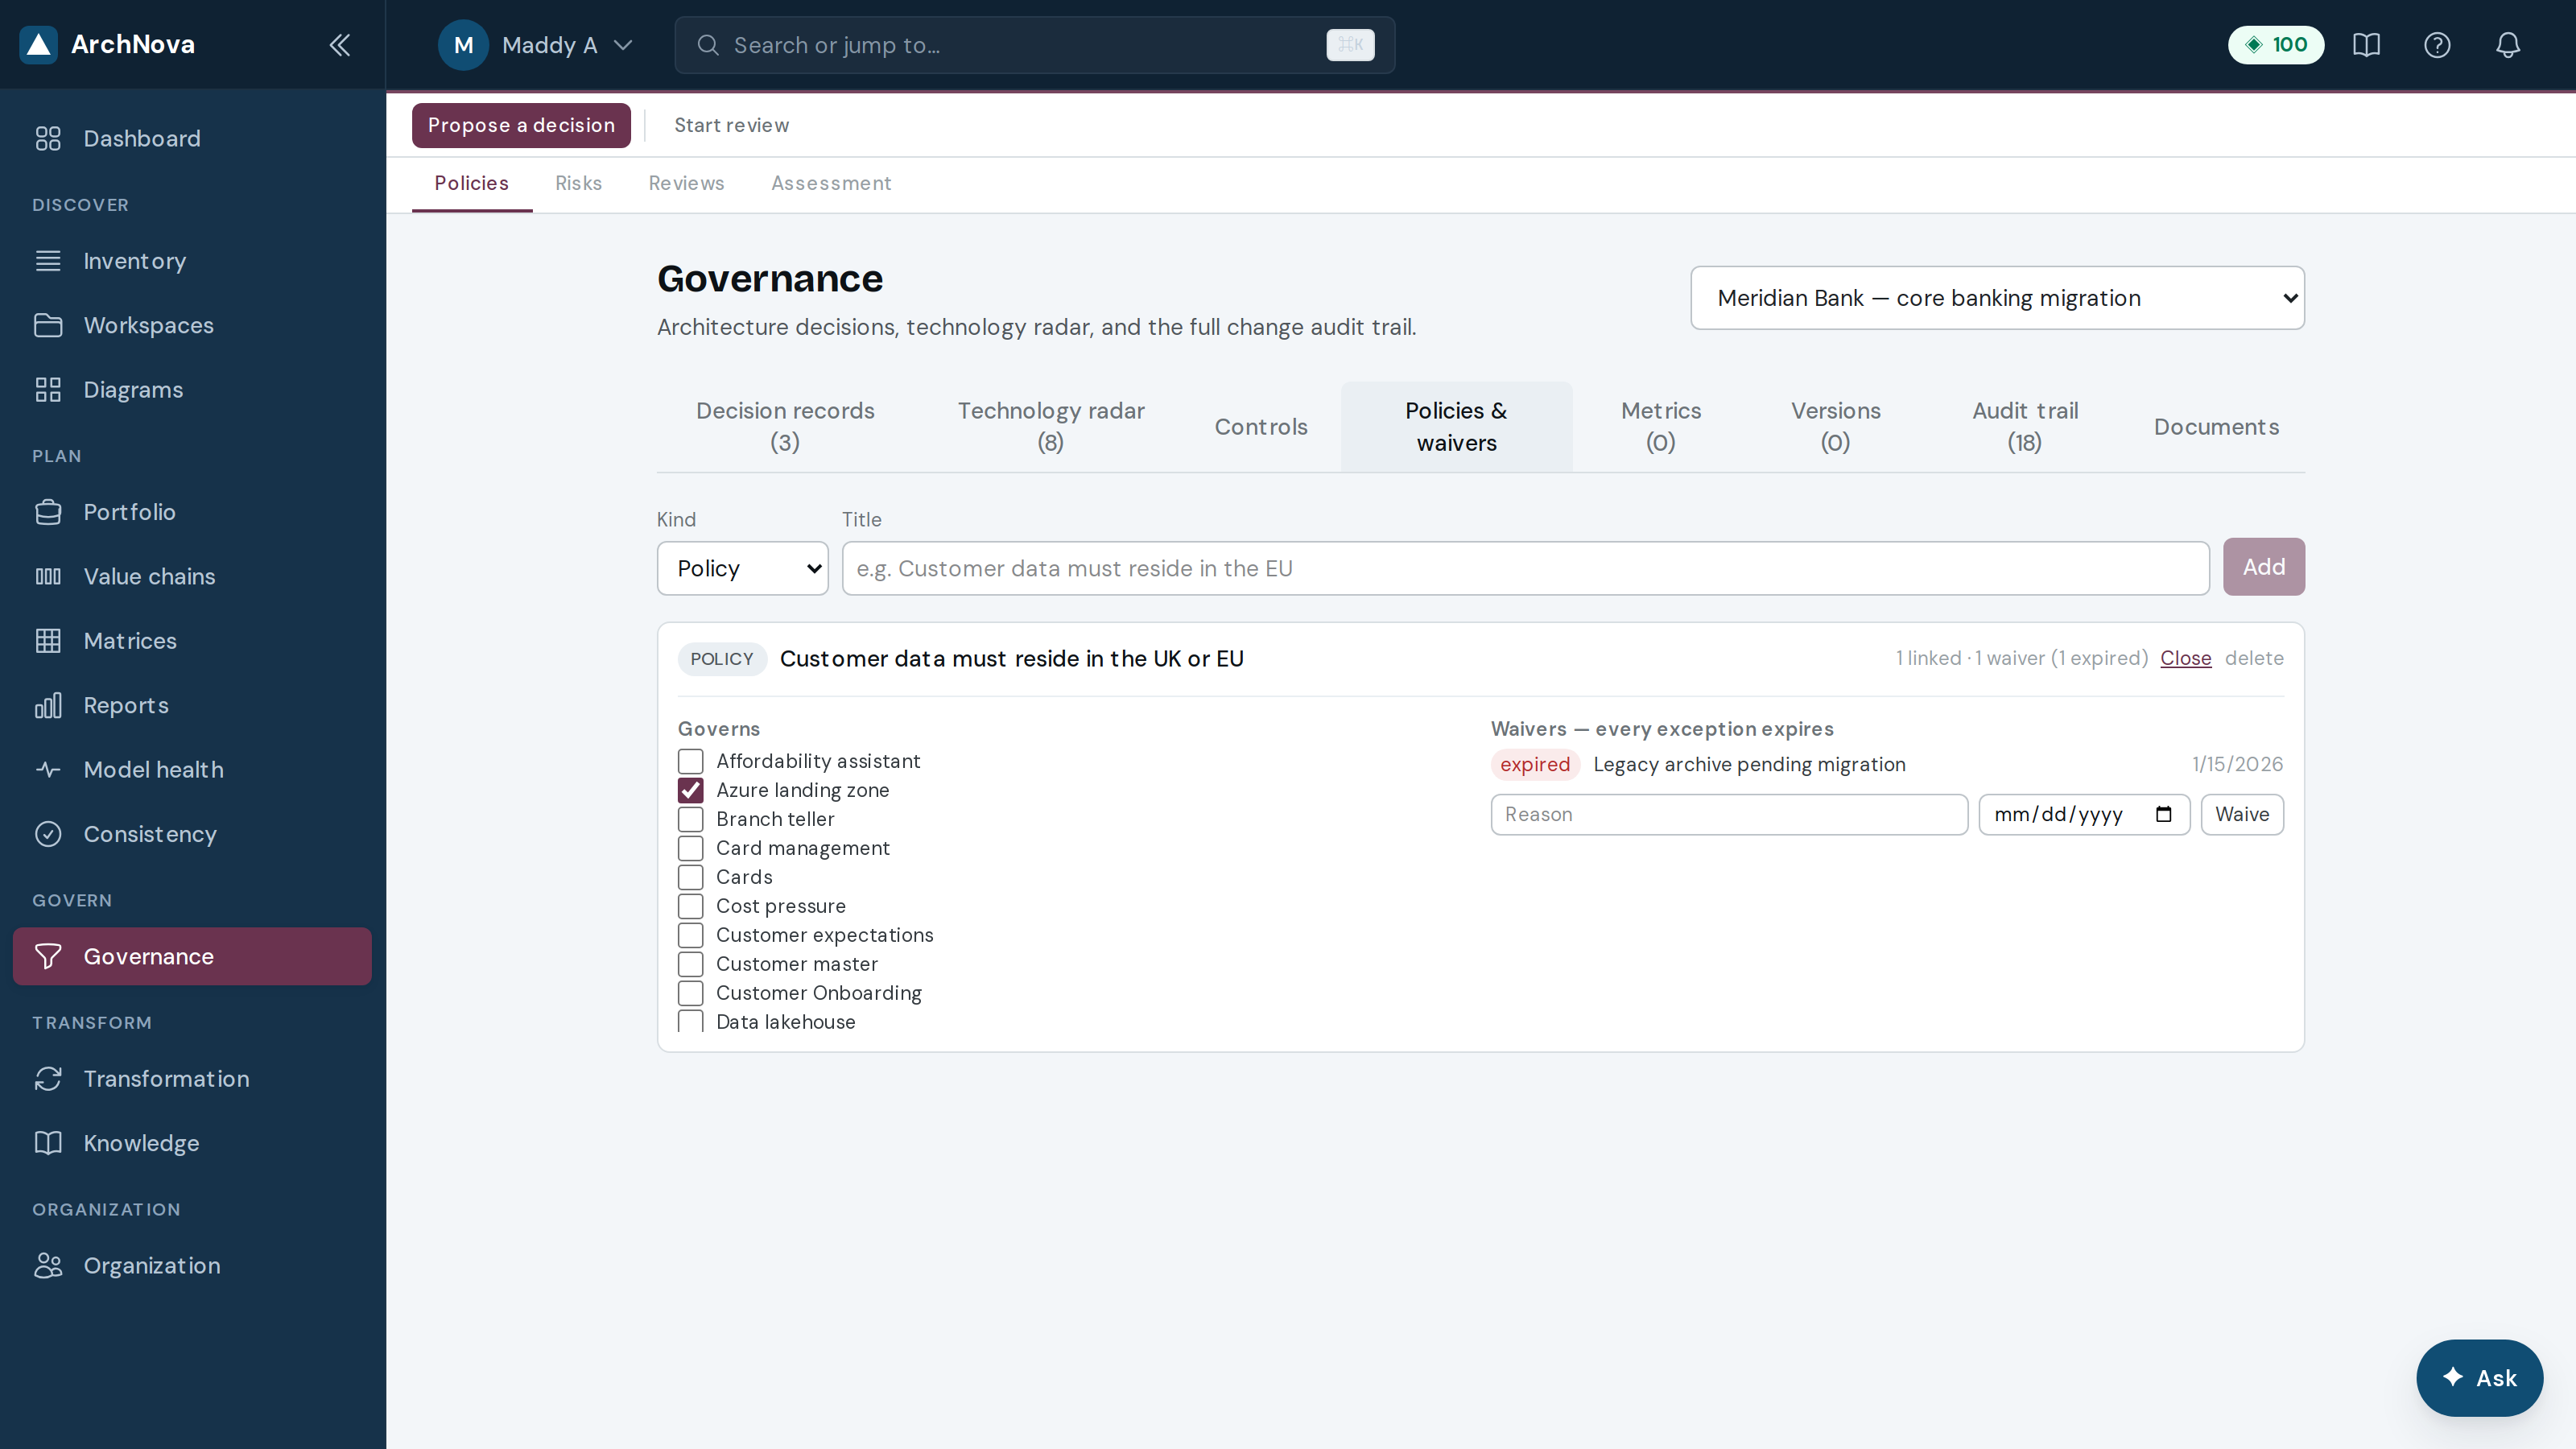
- Choose policy, standard or regulation, give it a title, and add it.
- Manage opens the element list — tick everything the policy governs.
- To grant an exception, write a reason and an expiry date, then Waive. The date is mandatory.
- Waivers past their date read as expired the moment you look, without waiting for any job to run.
27Assessment
A governance assessment scores your practice against a framework questionnaire, using your own uploaded evidence.
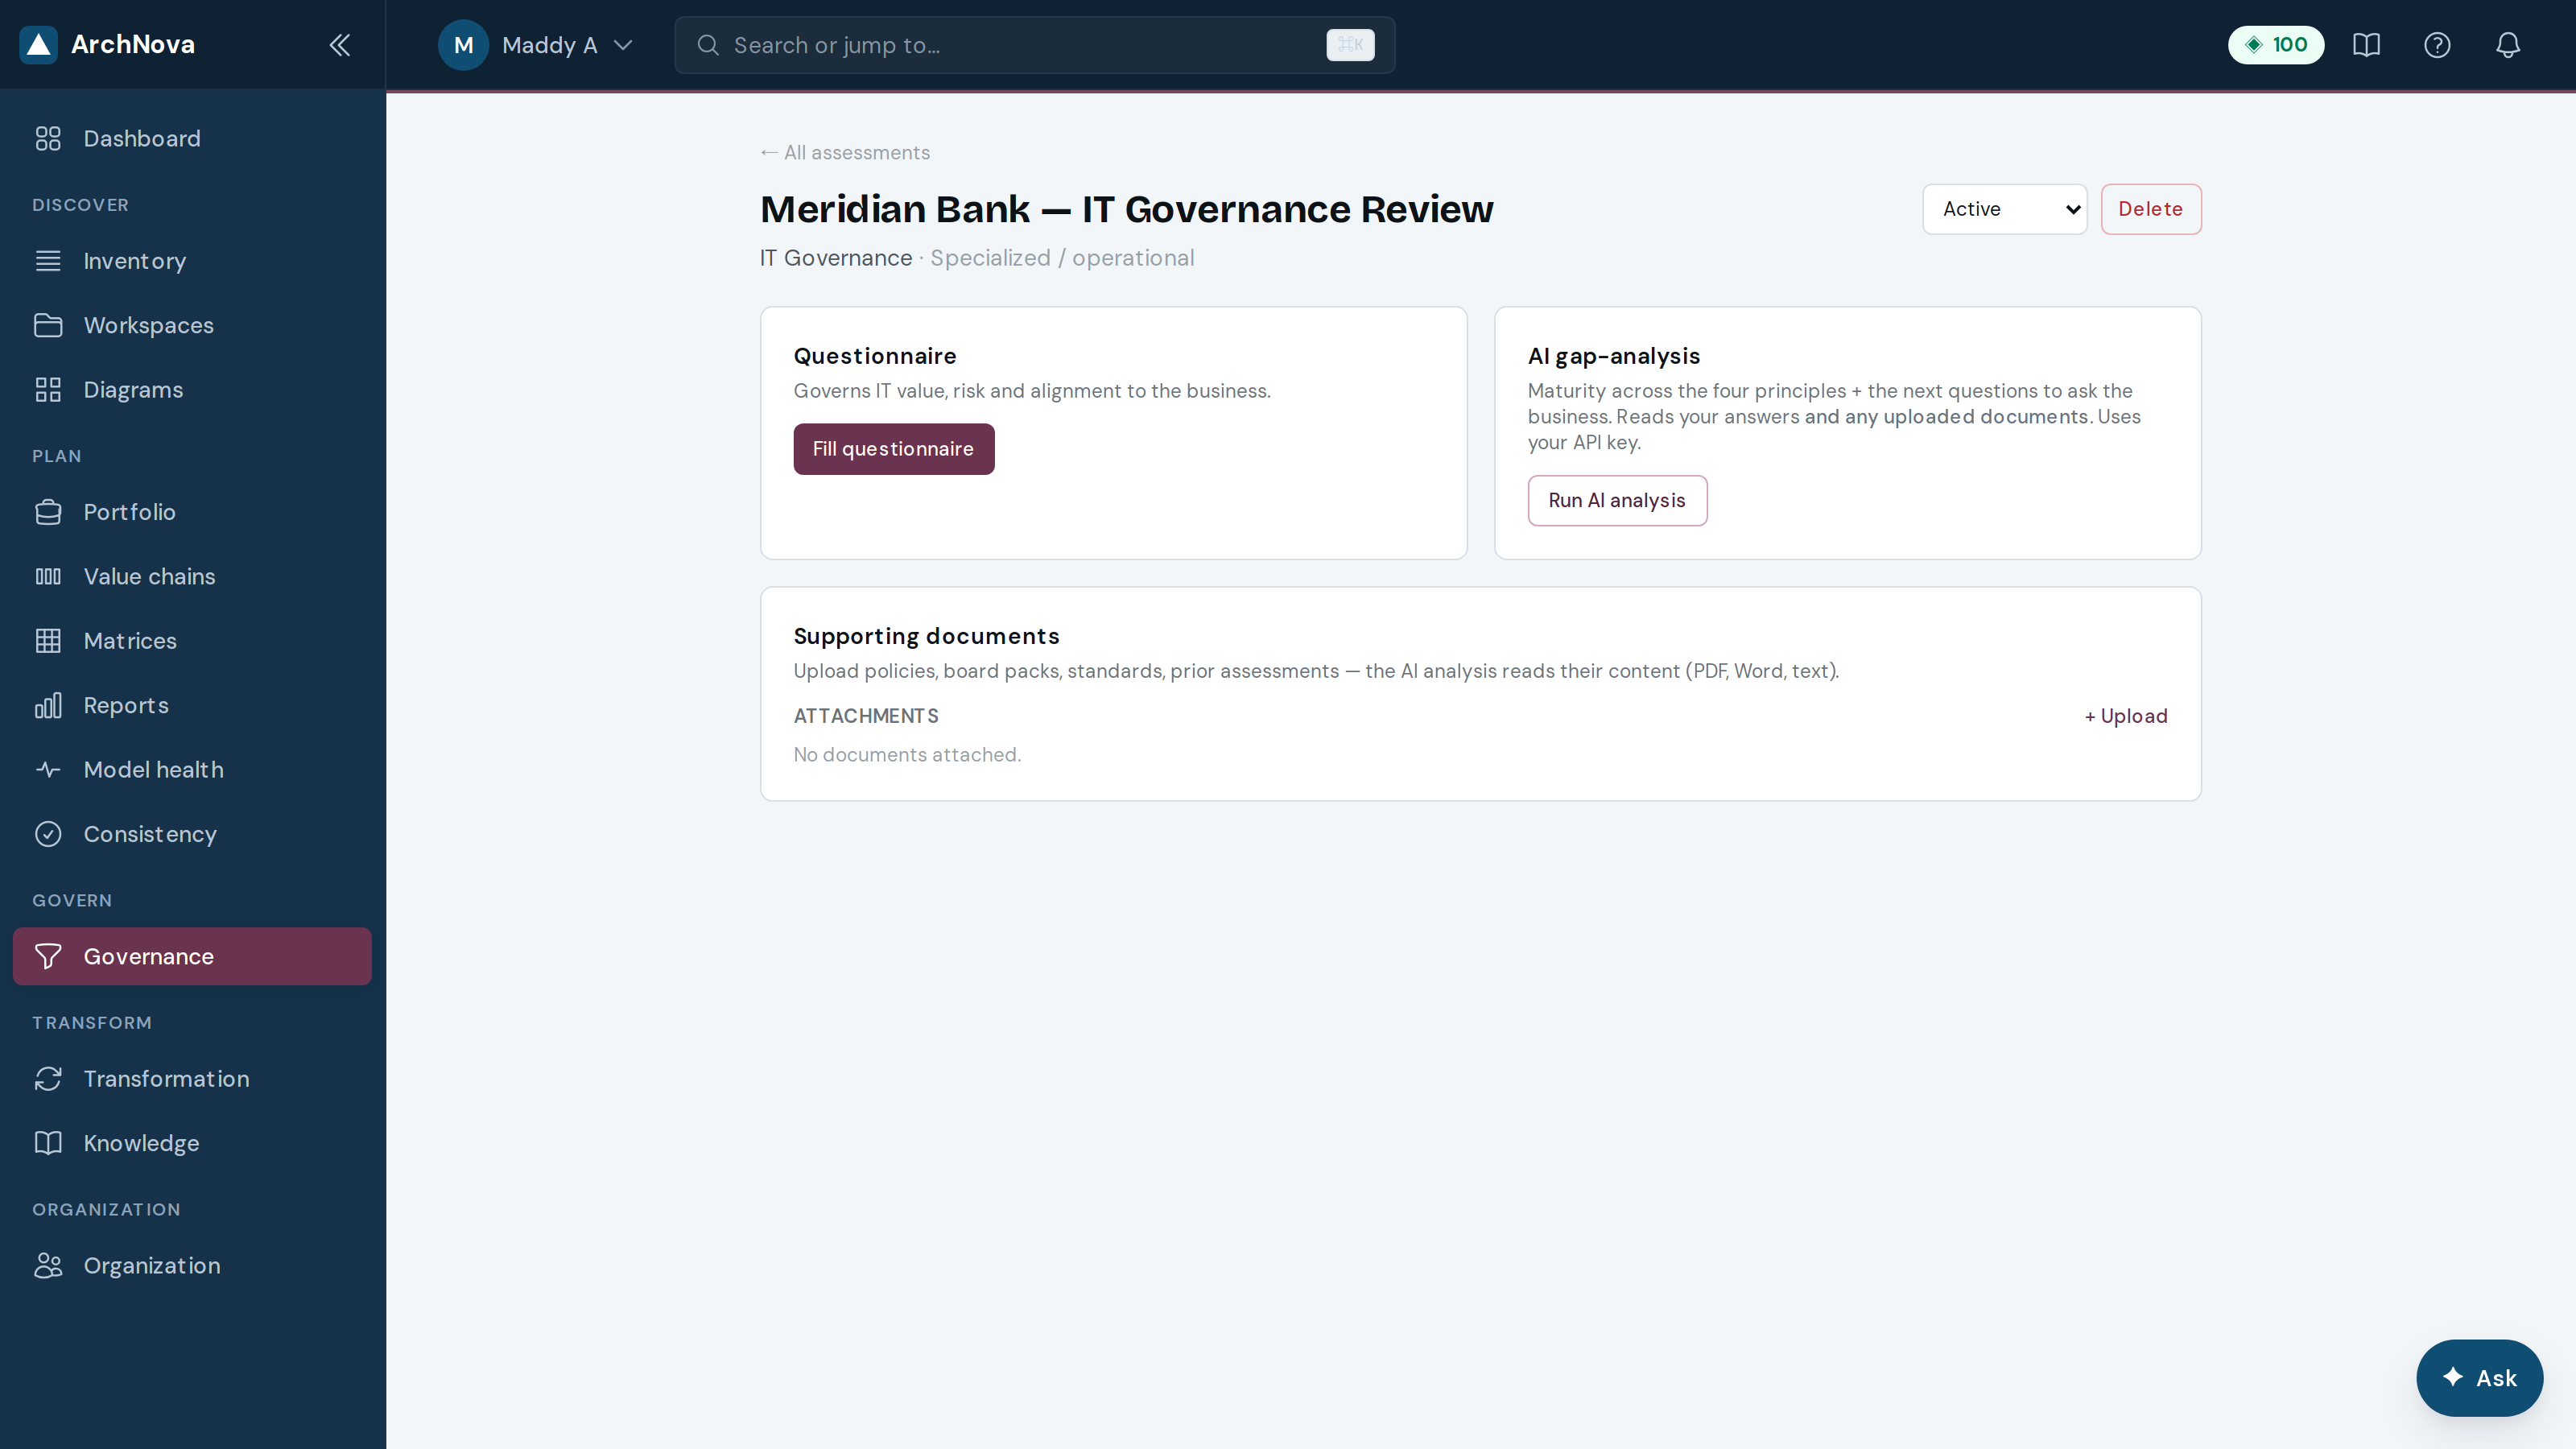
- Select New assessment, name it, and pick a framework. Choices cover high-level governance models (shareholder-centric, stakeholder-centric, family-owned) and operational ones (IT governance, Data & AI governance, ESG).
- Fill questionnaire — each framework asks about Accountability, Transparency, Fairness and Risk Management.
- Upload the evidence behind your answers as supporting documents.
- Run the AI gap analysis to compare your answers and evidence against the framework’s expectations.AI
Turning findings into delivery
Analysis that does not change anything is expensive decoration. Transform is where findings become programmes, initiatives and grounded answers.
28Programmes
Transformation runs business-change programmes against measurable benefit — the delivery side of the architecture you just analysed.
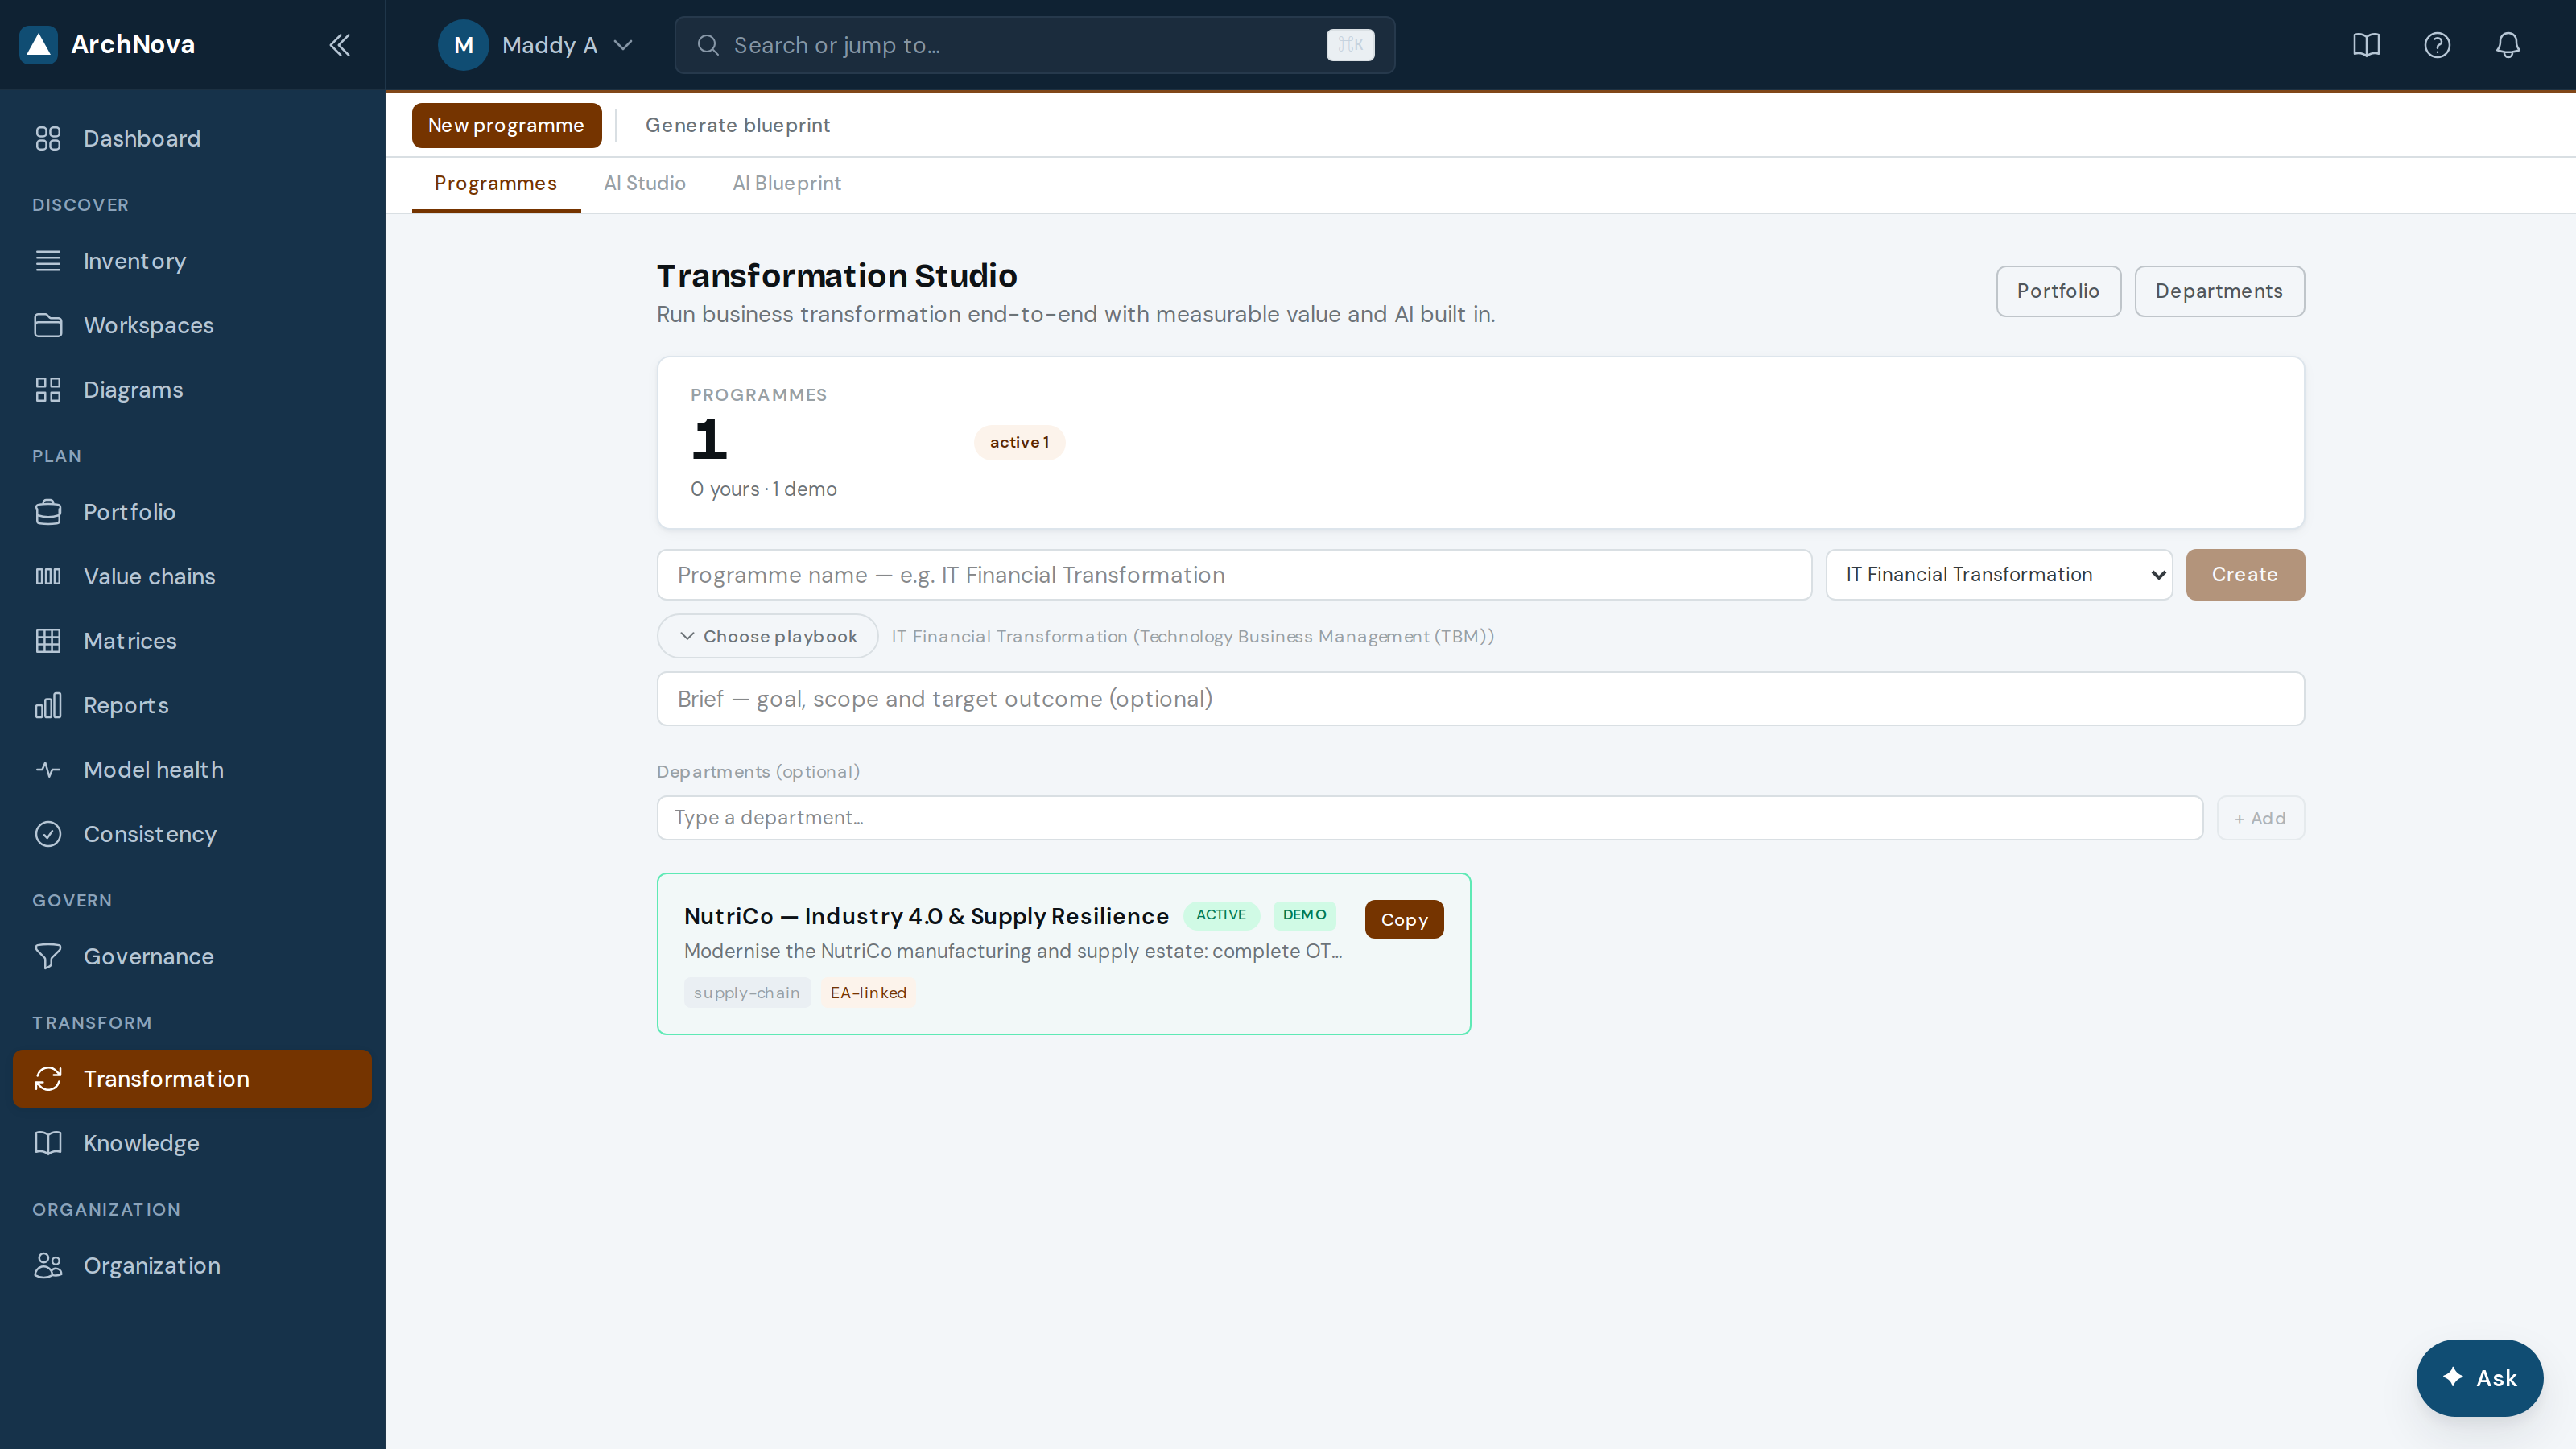
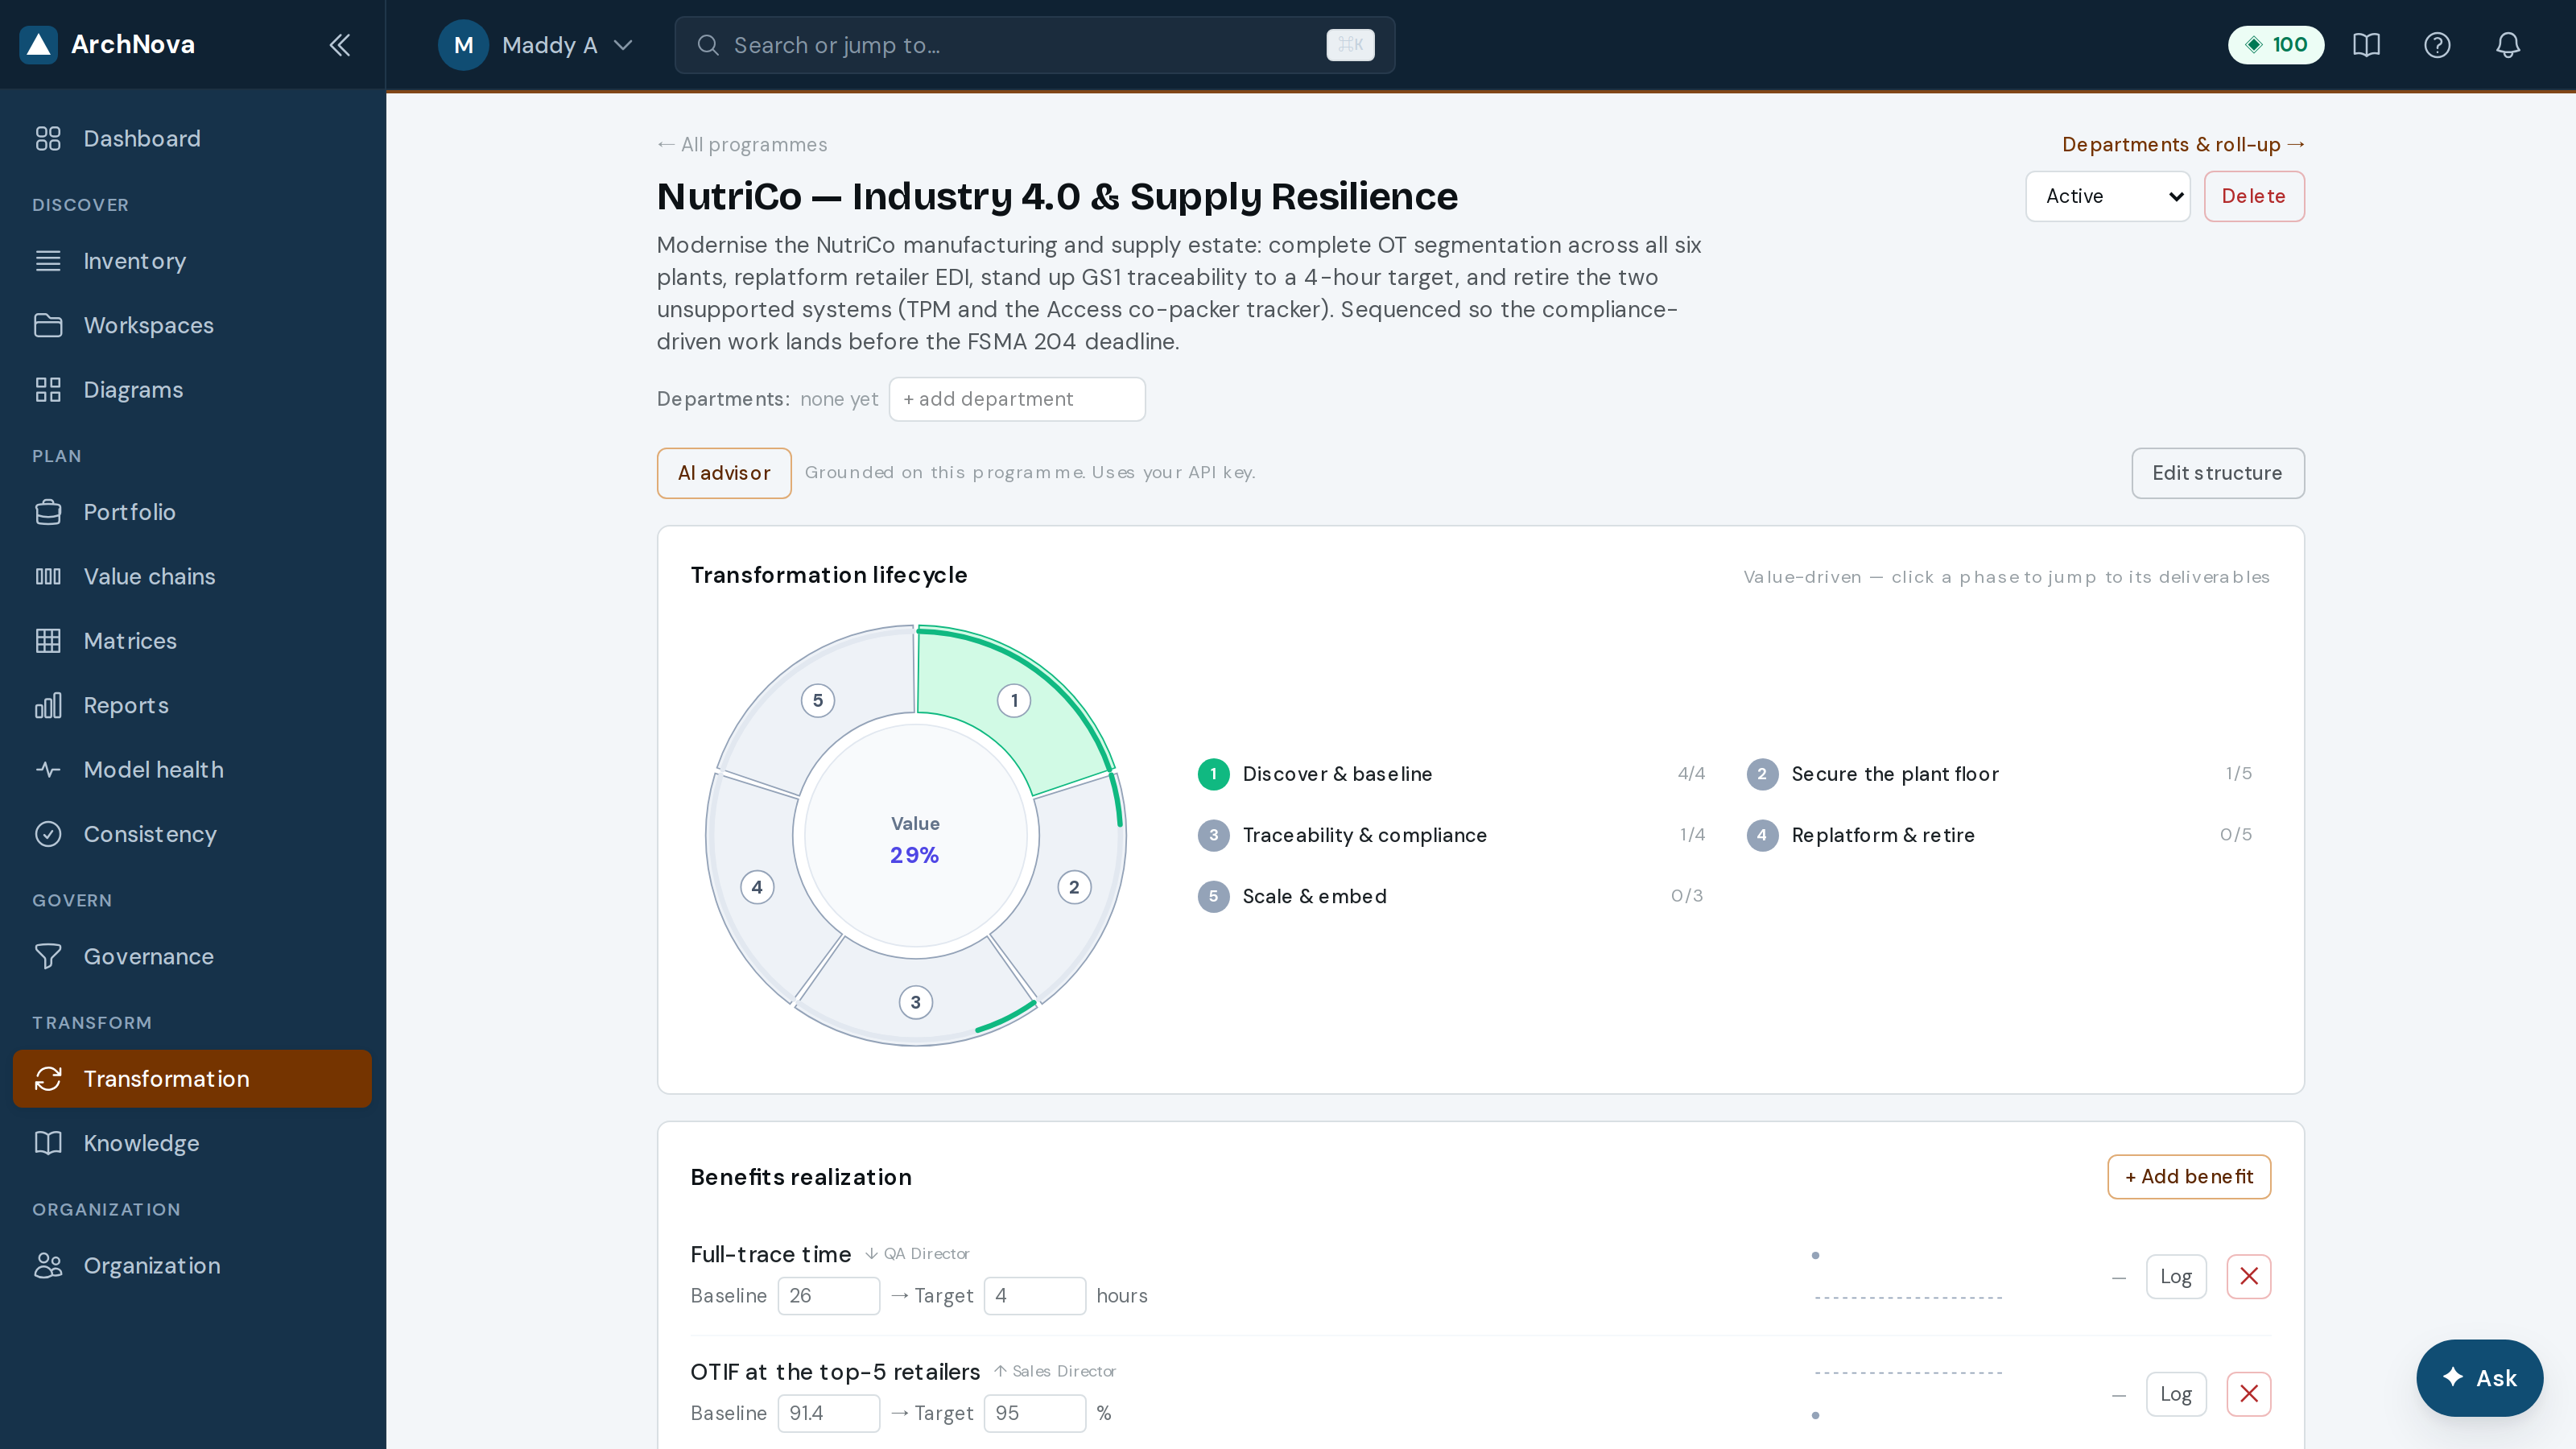
- Create a programme, name the departments it touches, and describe the outcome.
- Work through the lifecycle — discover, define, secure the plan, deliver, realise the benefit.
- Record benefits with a baseline and a target so realisation can be measured rather than asserted.
- Optionally link it to the EA model to pull in blast radius, cost and carbon.
29AI Studio
AI Studio runs AI initiatives through a governed lifecycle — the place to manage AI adoption as a portfolio rather than a series of experiments.
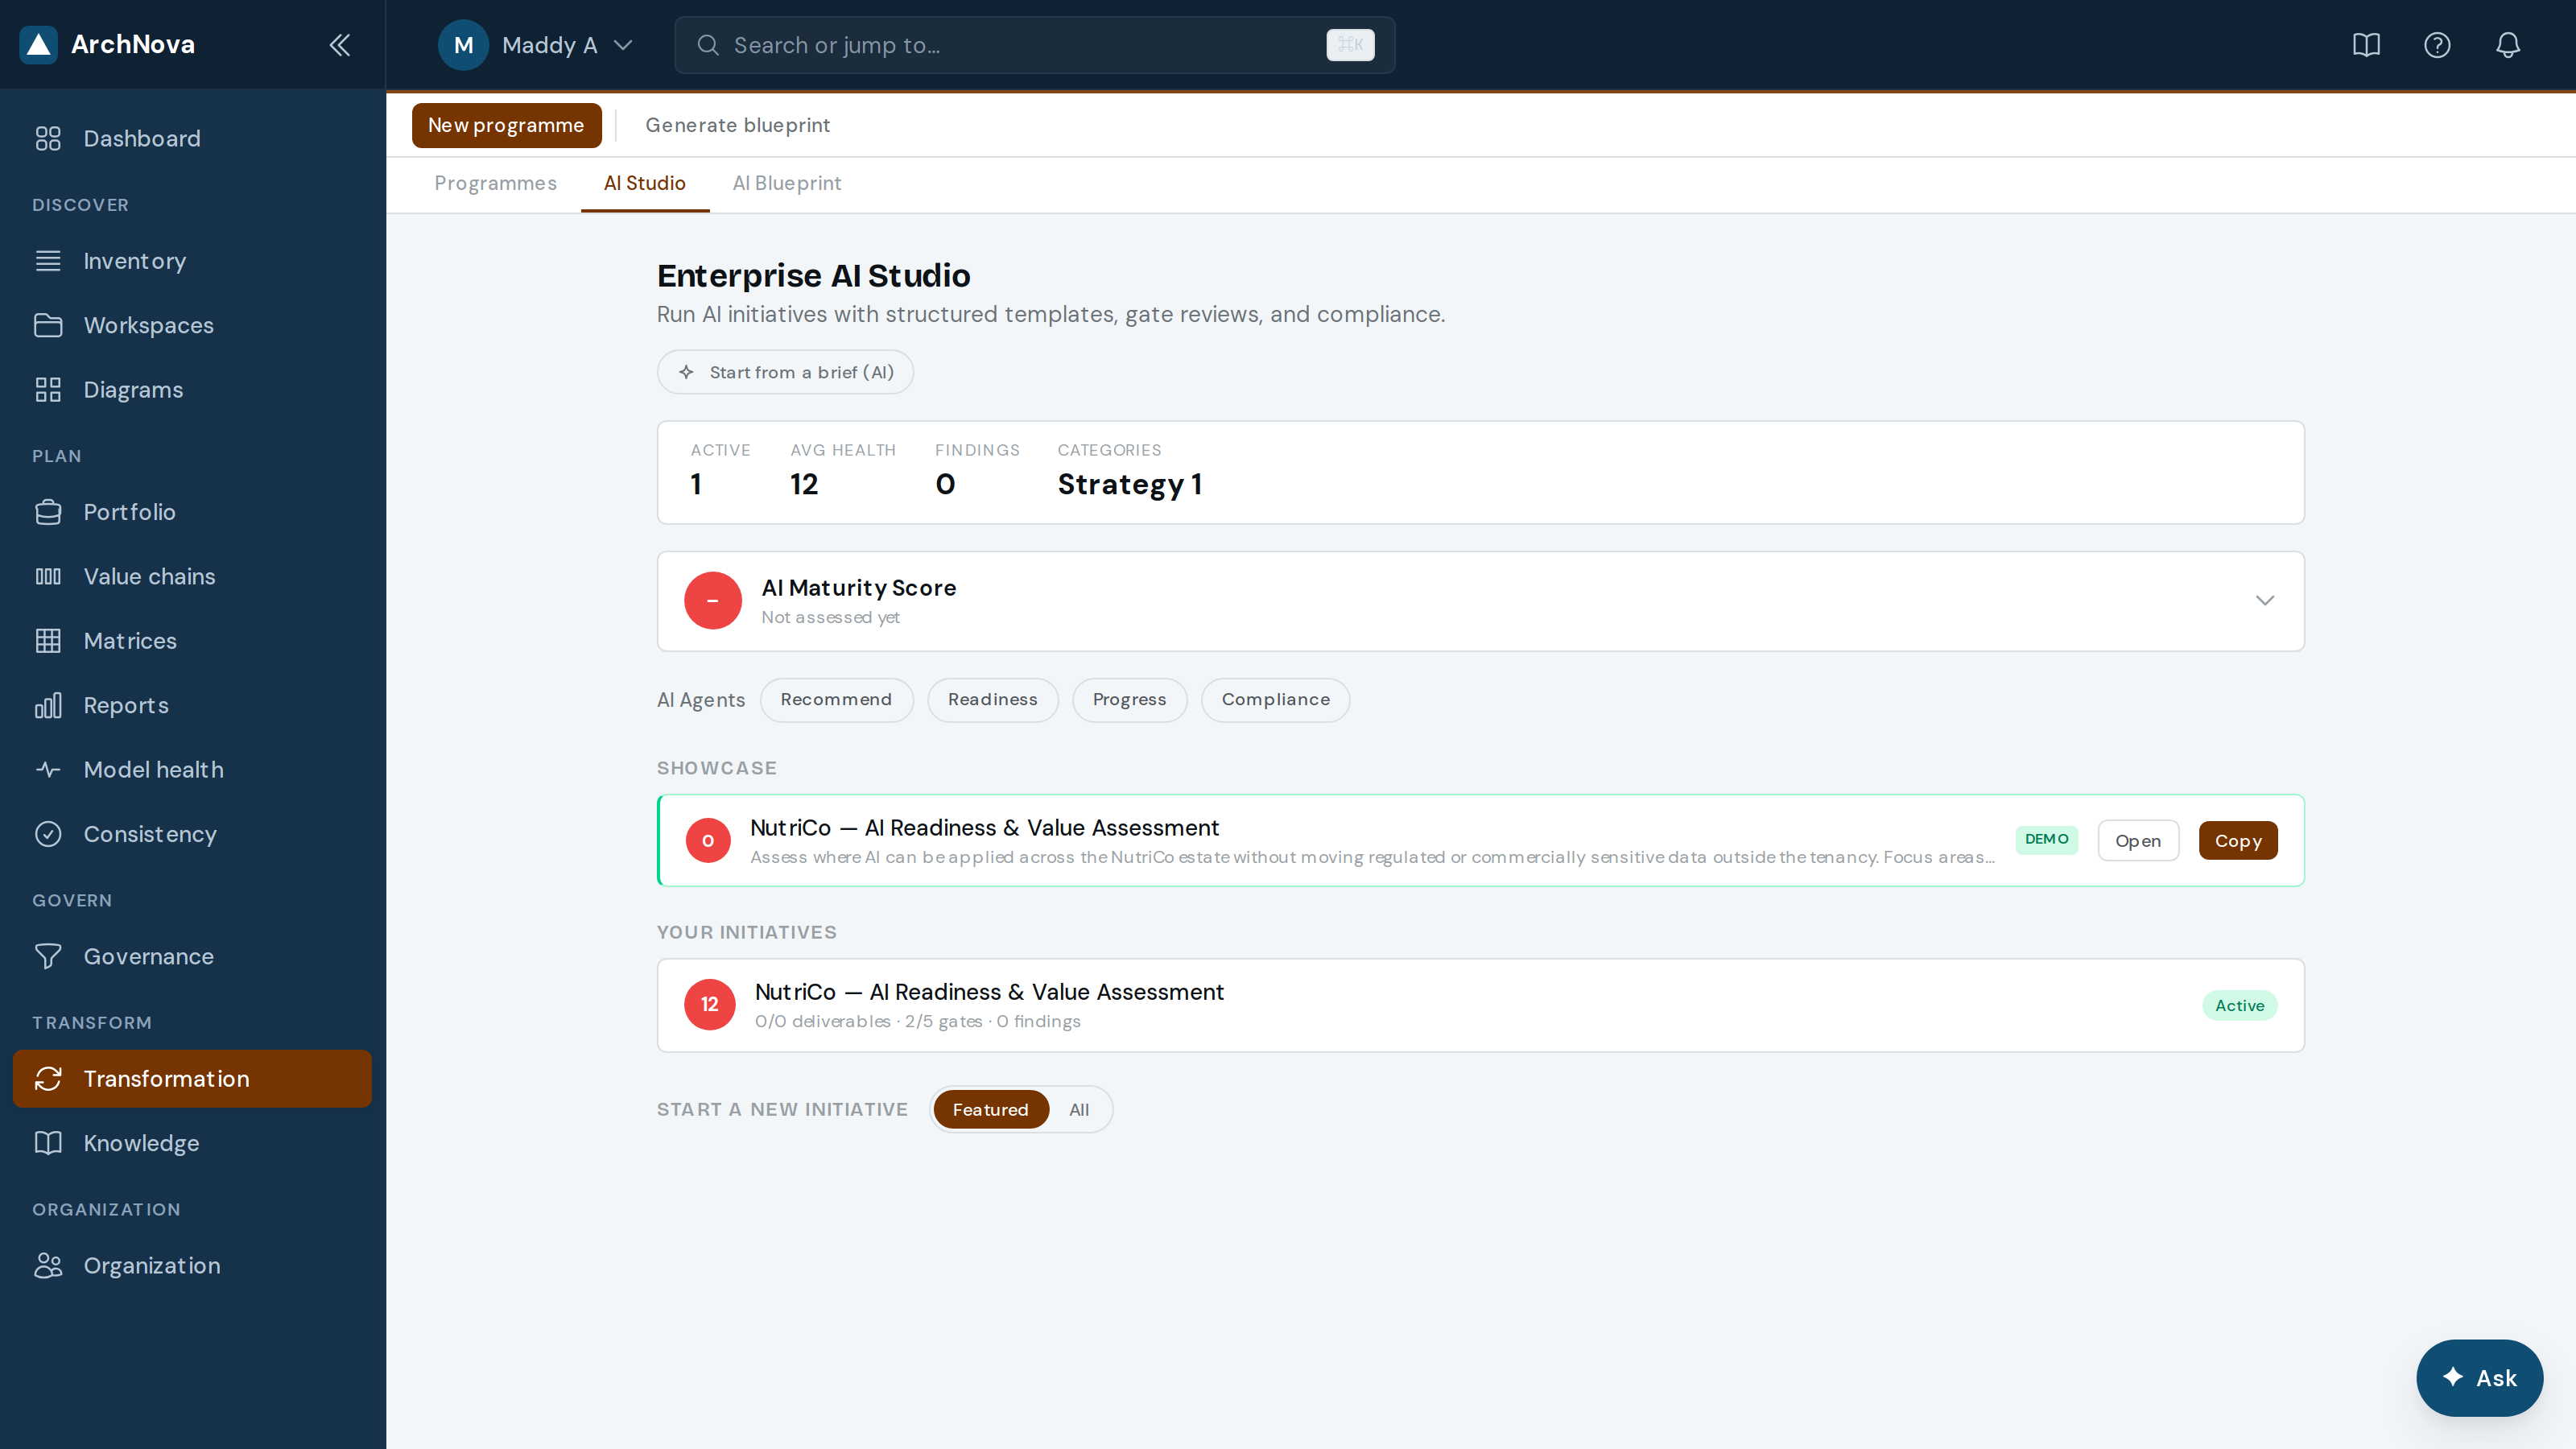
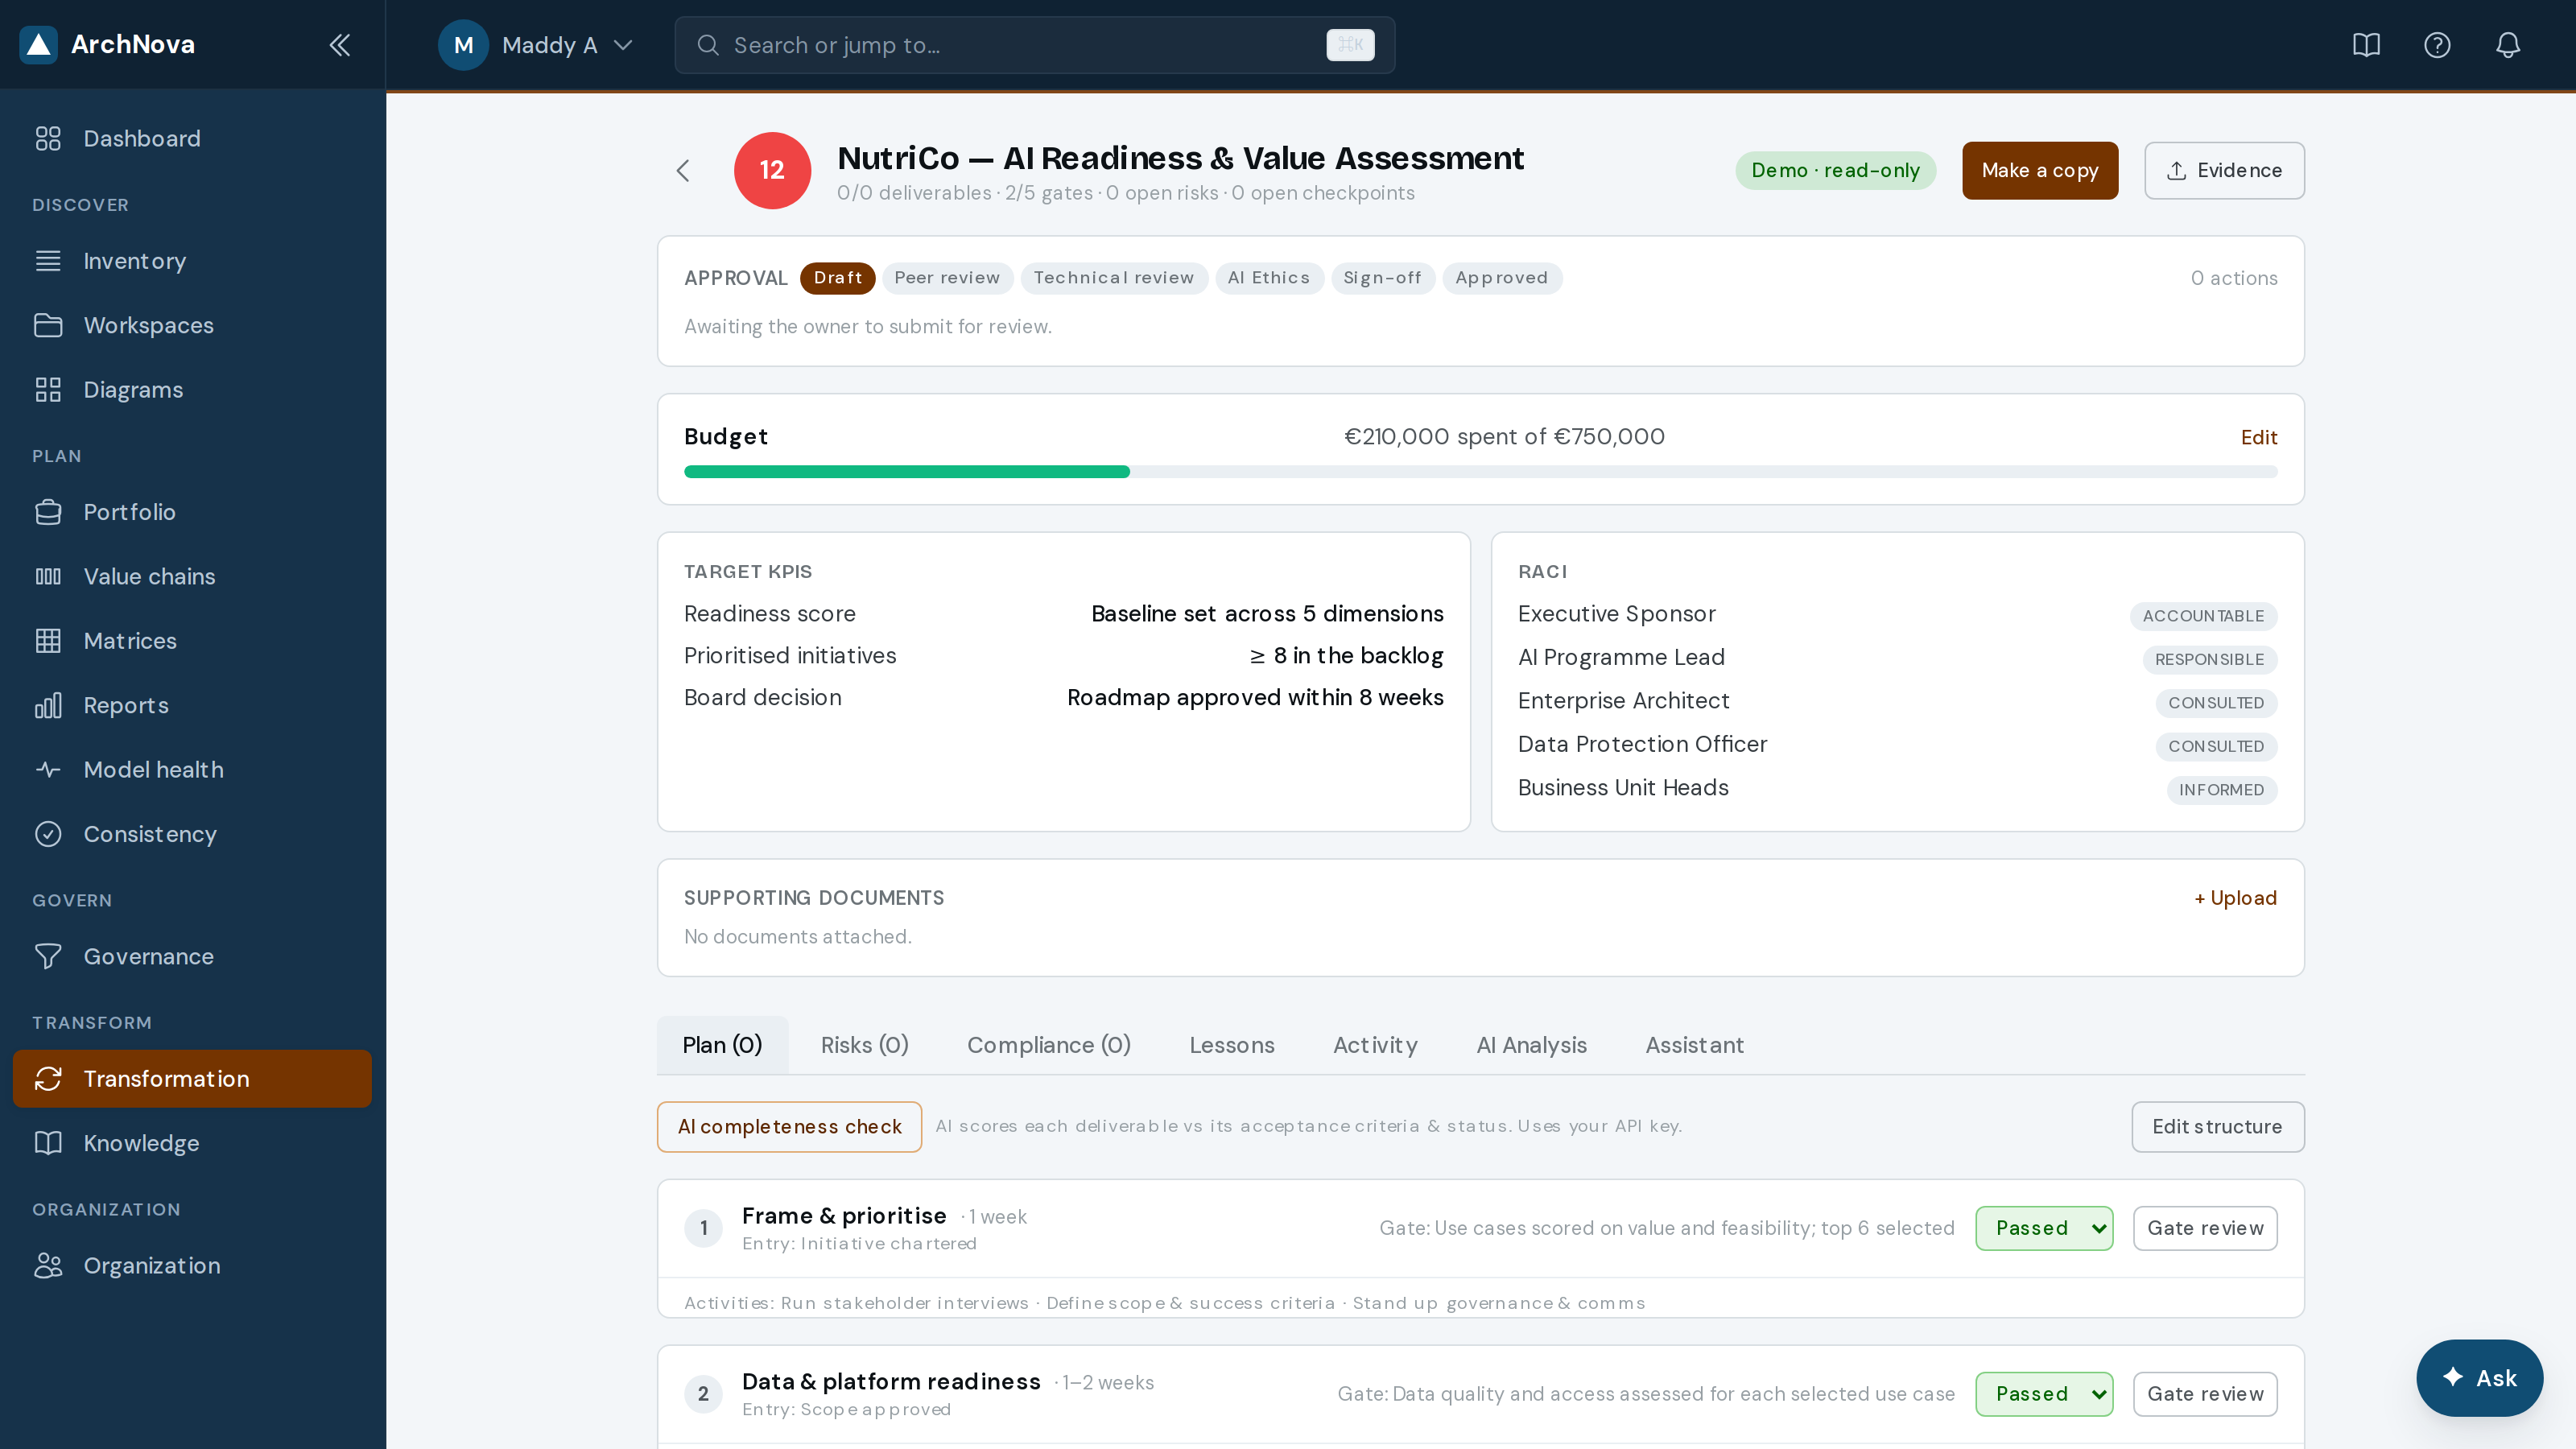
- Start an initiative from a template or from scratch.
- Fill in phases and deliverables; assign owners and gates.
- Track budget planned against spent, and clear the compliance checkpoints before each gate.
- Run an AI analysis for a readiness view, or publish the initiative as a showcase demo.AI
30AI Blueprint
A blueprint describes an AI-native target operating model across four views — functionality, reference model, roadmap and value.
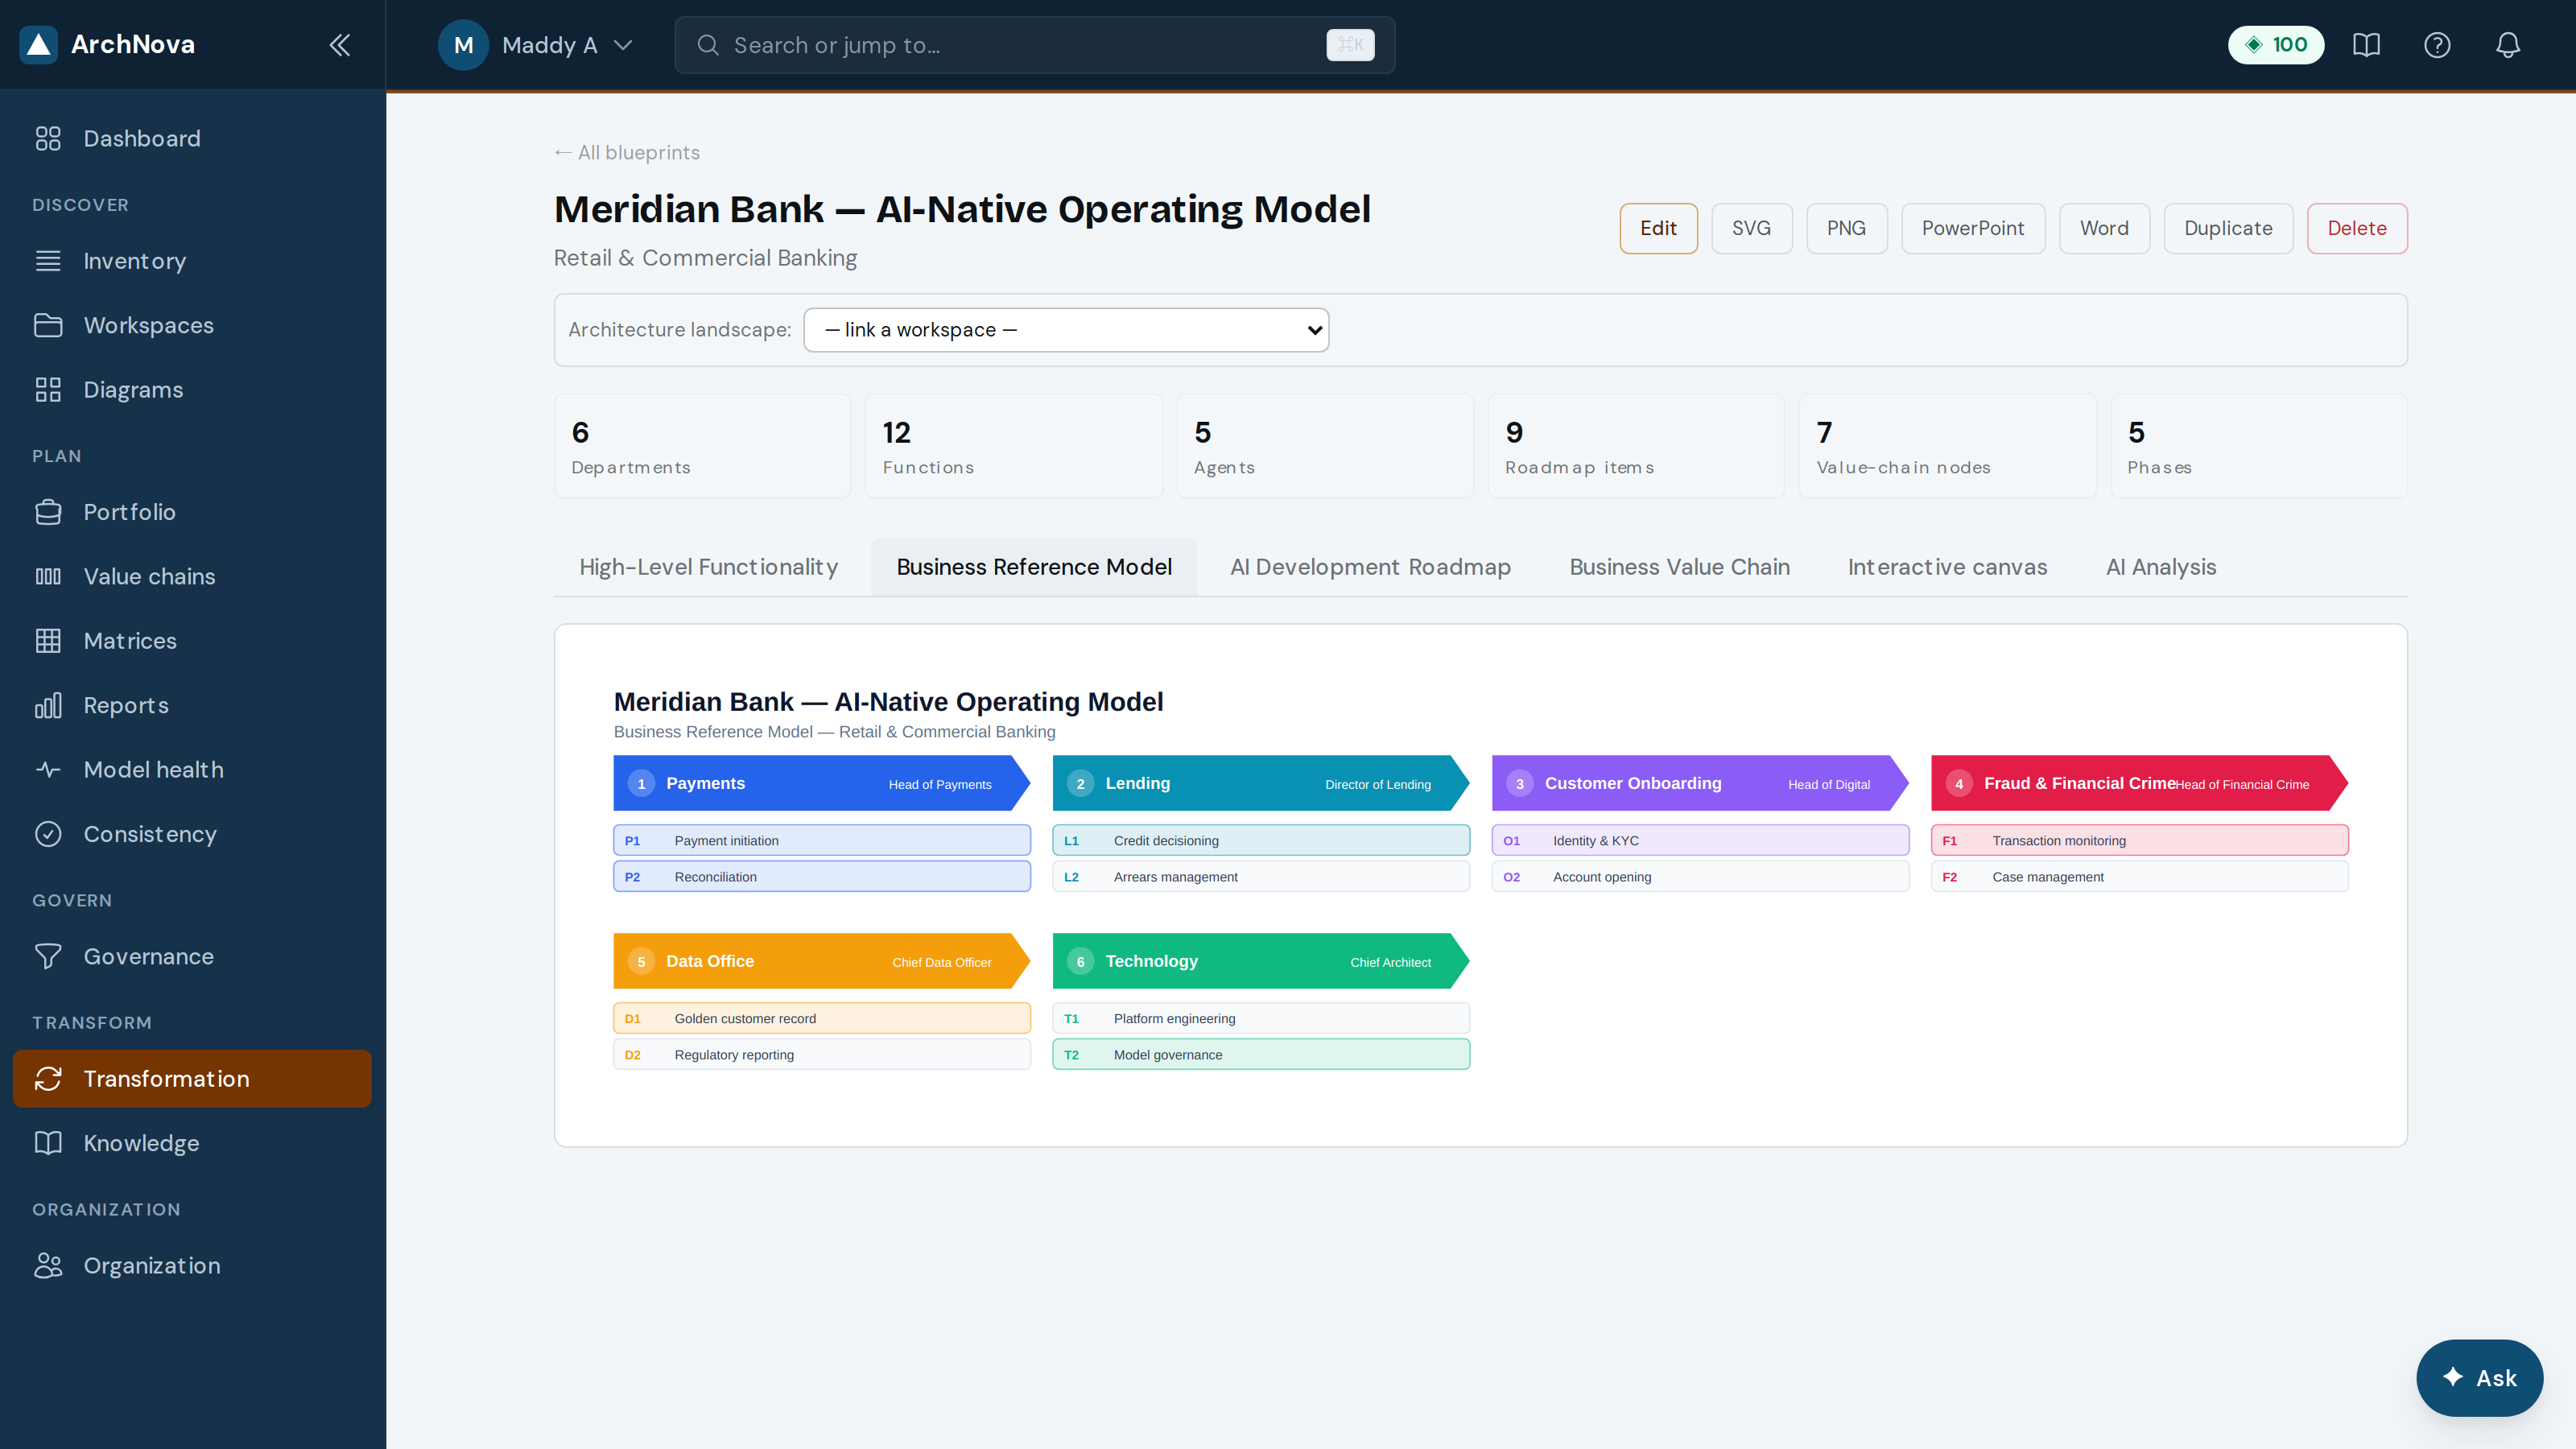
The four views answer four different questions:
| View | Answers |
|---|---|
| High-level functionality | What each department does, and which functions are core versus enabling. |
| Business reference model | Where AI agents sit against those functions, and what kind each is. |
| AI development roadmap | The sequence — which sprint, which department, what depends on what. |
| Business value chain | How value reaches the customer, from attract through to reporting. |
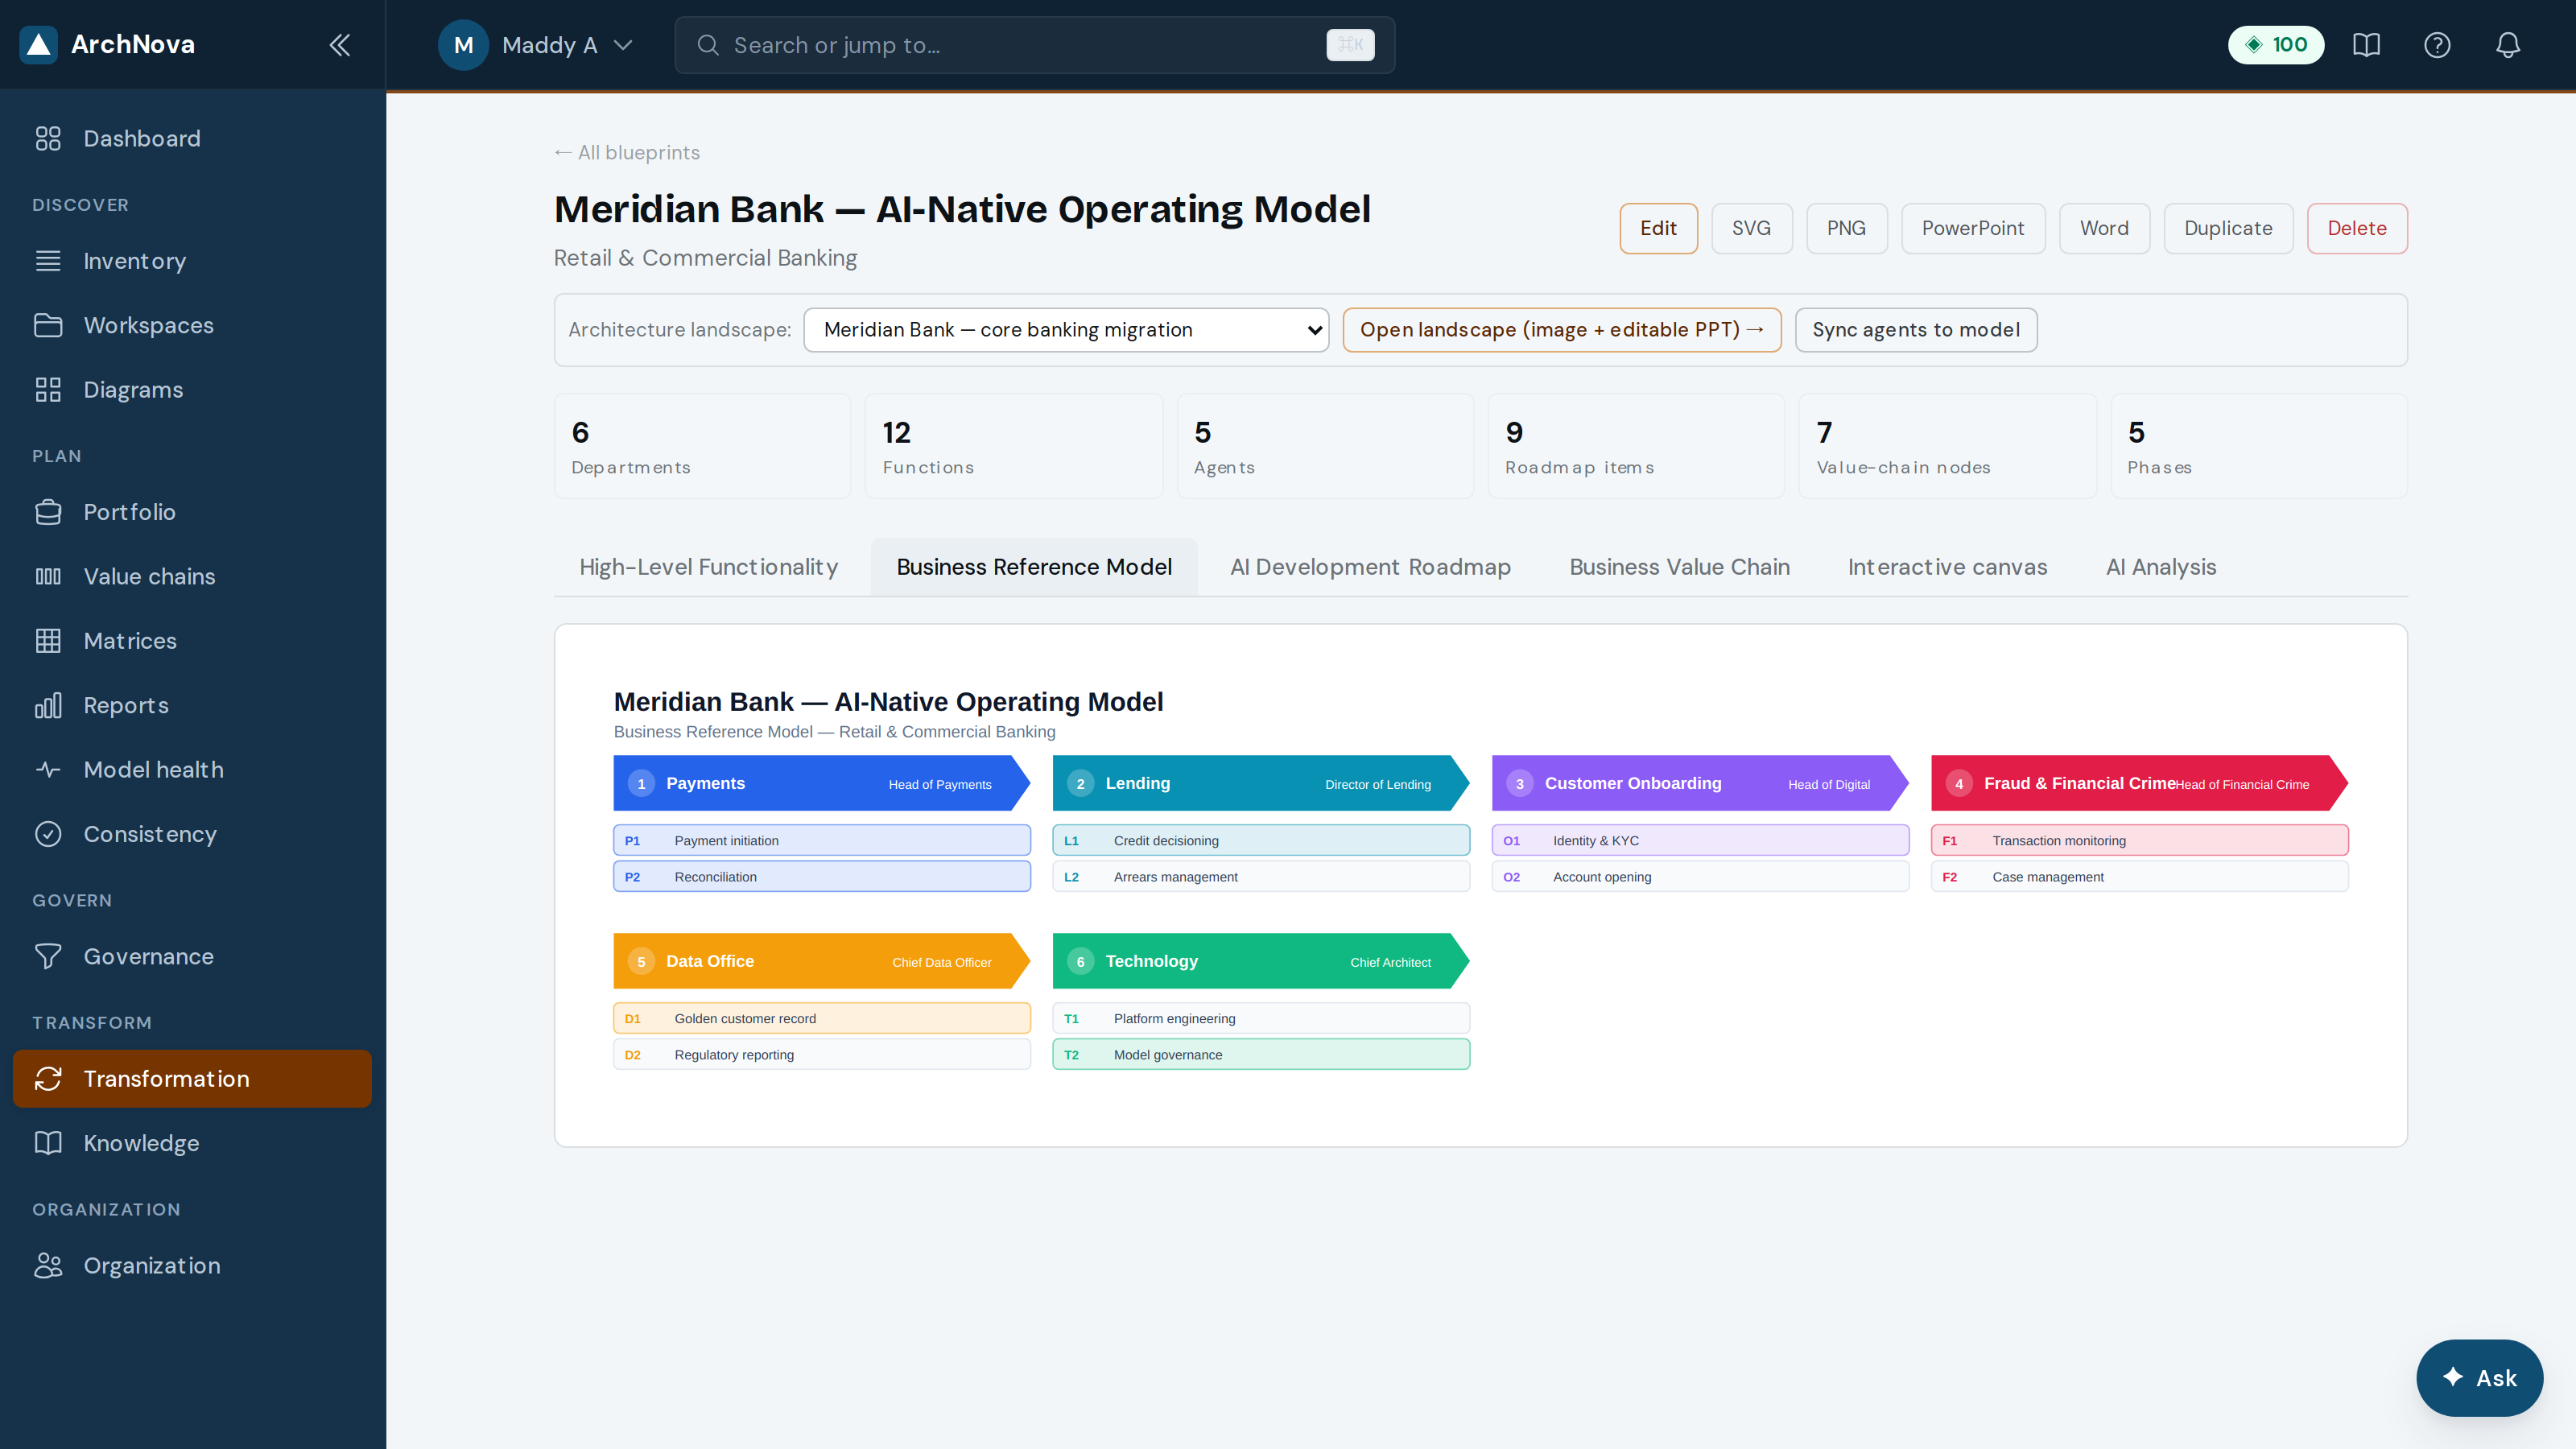
- Describe the business in the brief and select Generate with AI, or build it up manually.AI
- Work the four views in turn; everything stays editable after generation.
- Assign tools, departments and named owners so the blueprint maps to real accountability rather than boxes.
- Export to PPTX or Word when it needs to leave the tool.
31Knowledge Library
The Knowledge Library holds curated best-practice references and your own documents, so AI answers can be grounded in something better than a general model’s memory.
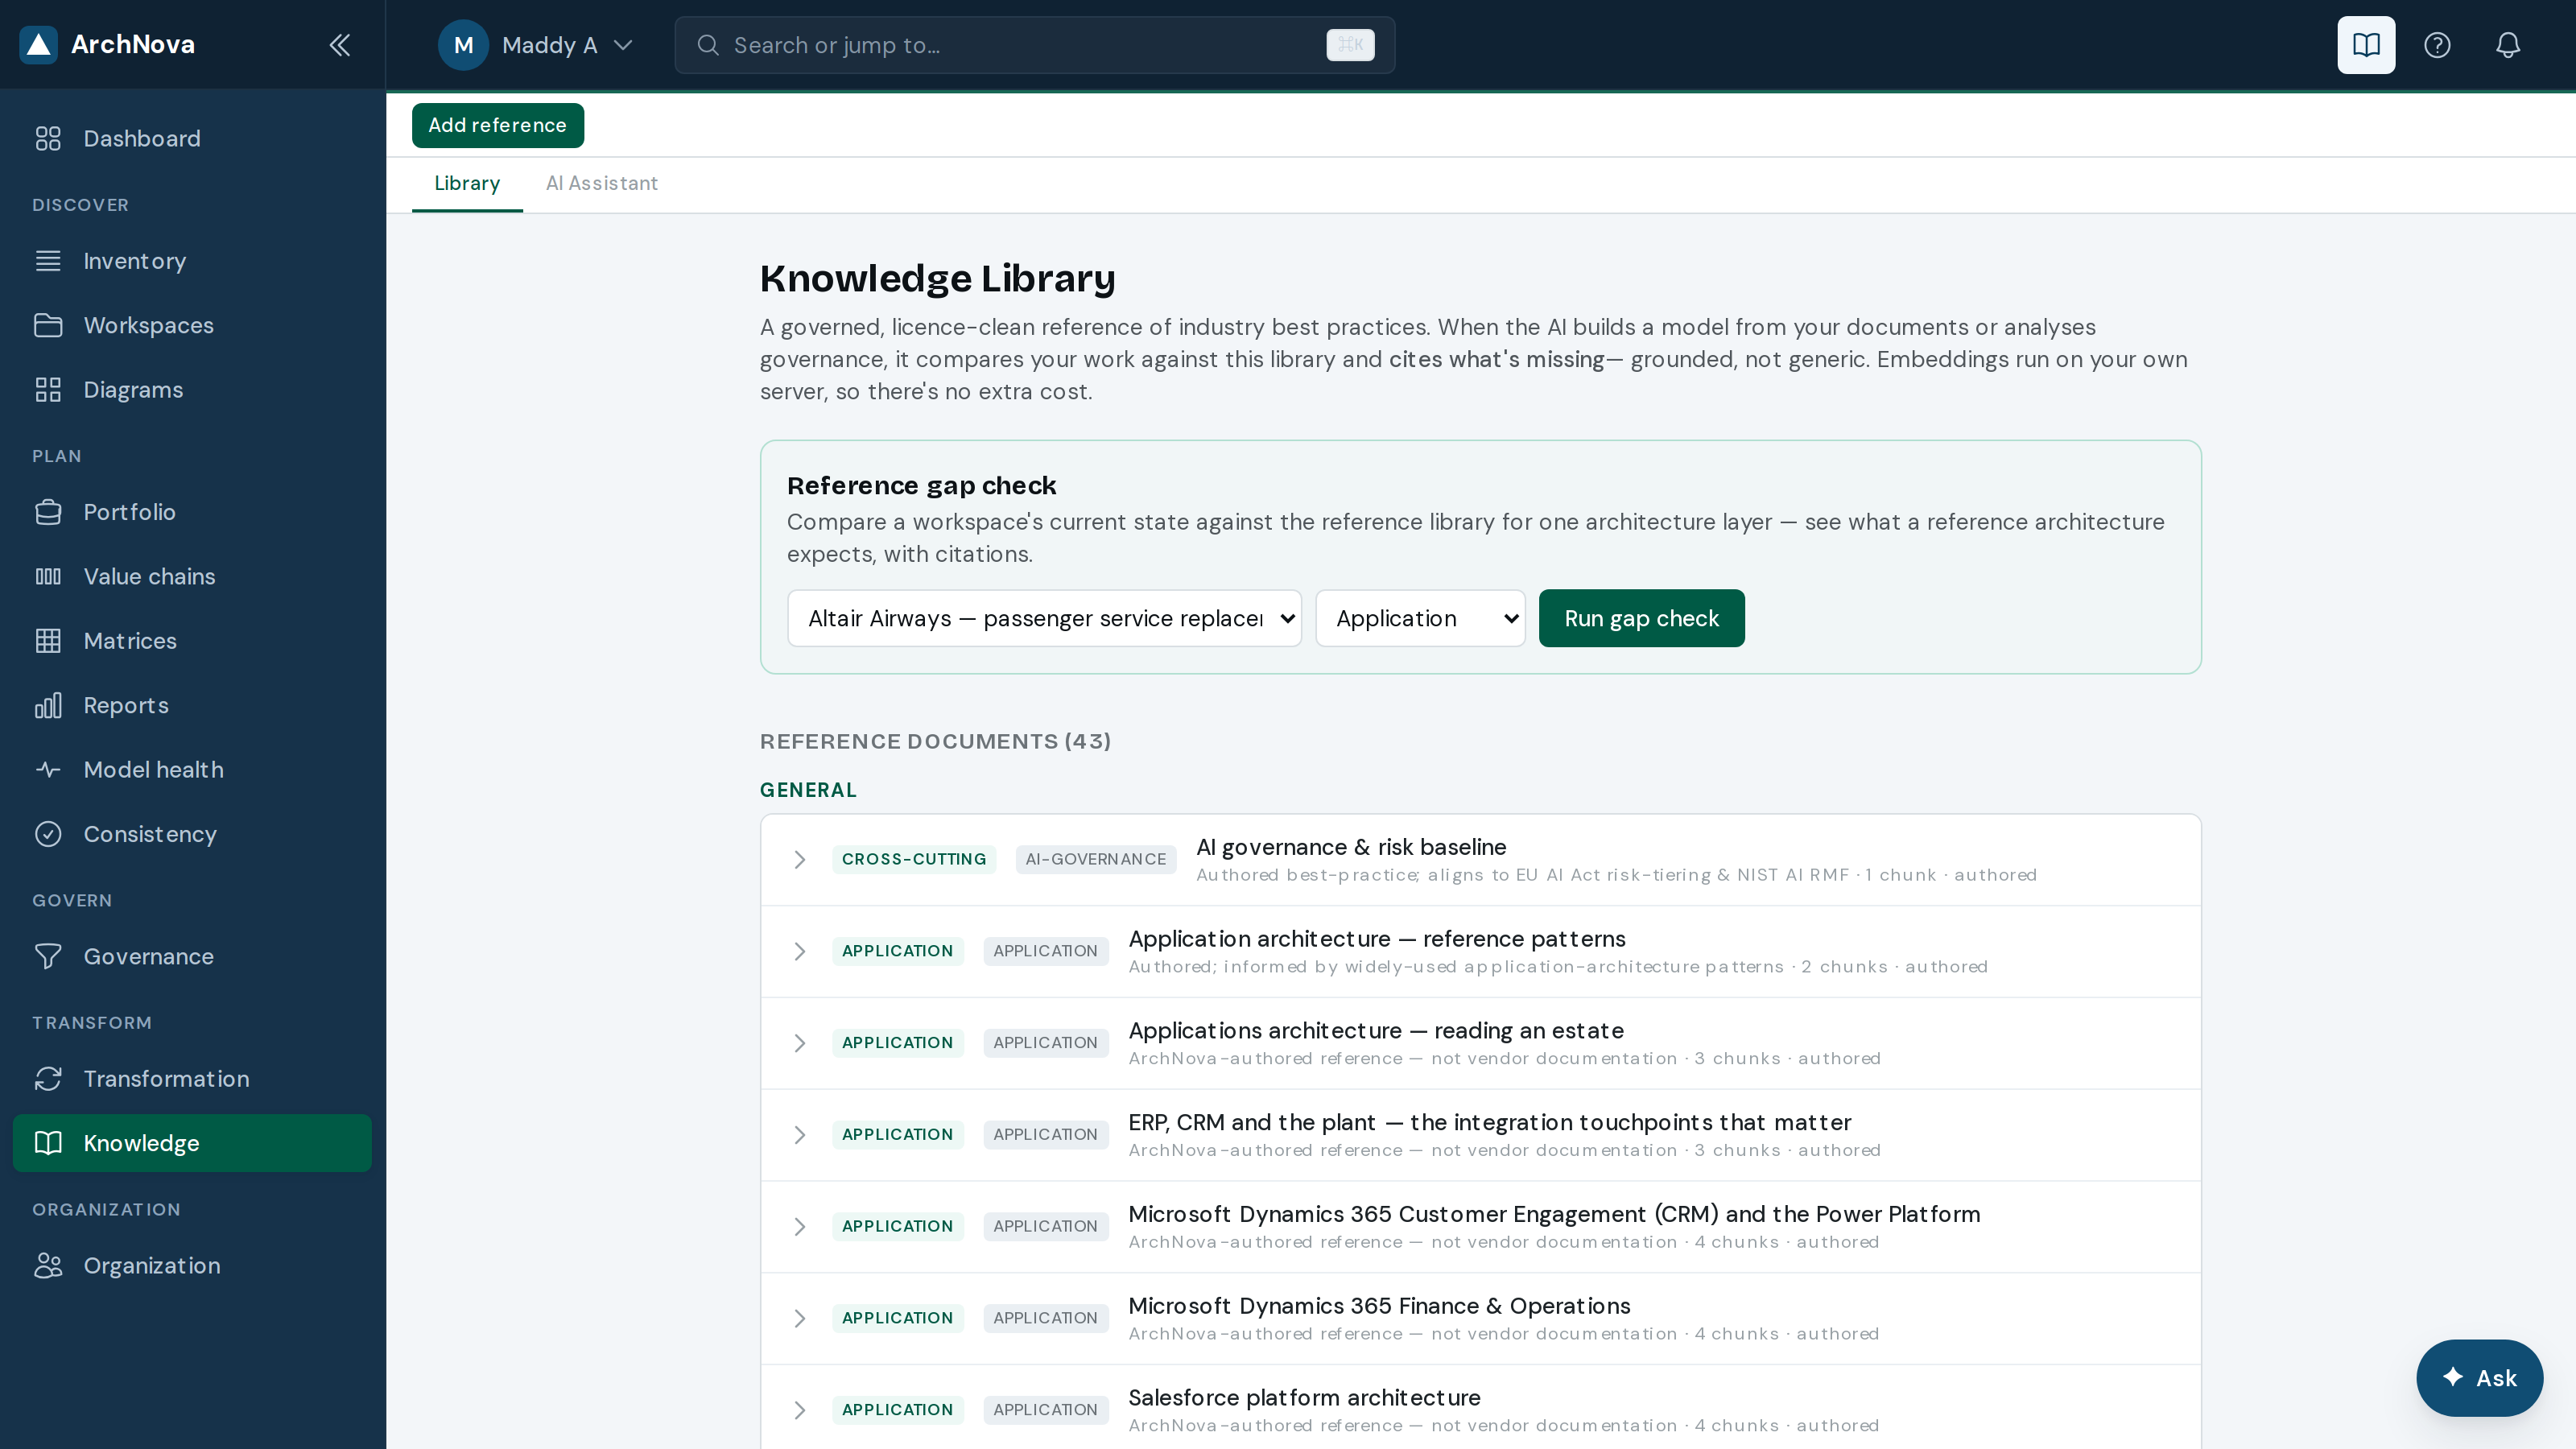
- Browse the built-in references, or Add reference to bring in your own standards and patterns.
- Use the reference gap check to compare a workspace against a reference architecture and see what you are missing.AI
- Grounded answers cite the reference they came from — follow the citation before acting on it.
32AI AssistantAI
The assistant answers questions about a specific workspace and runs the four standard analyses over it.
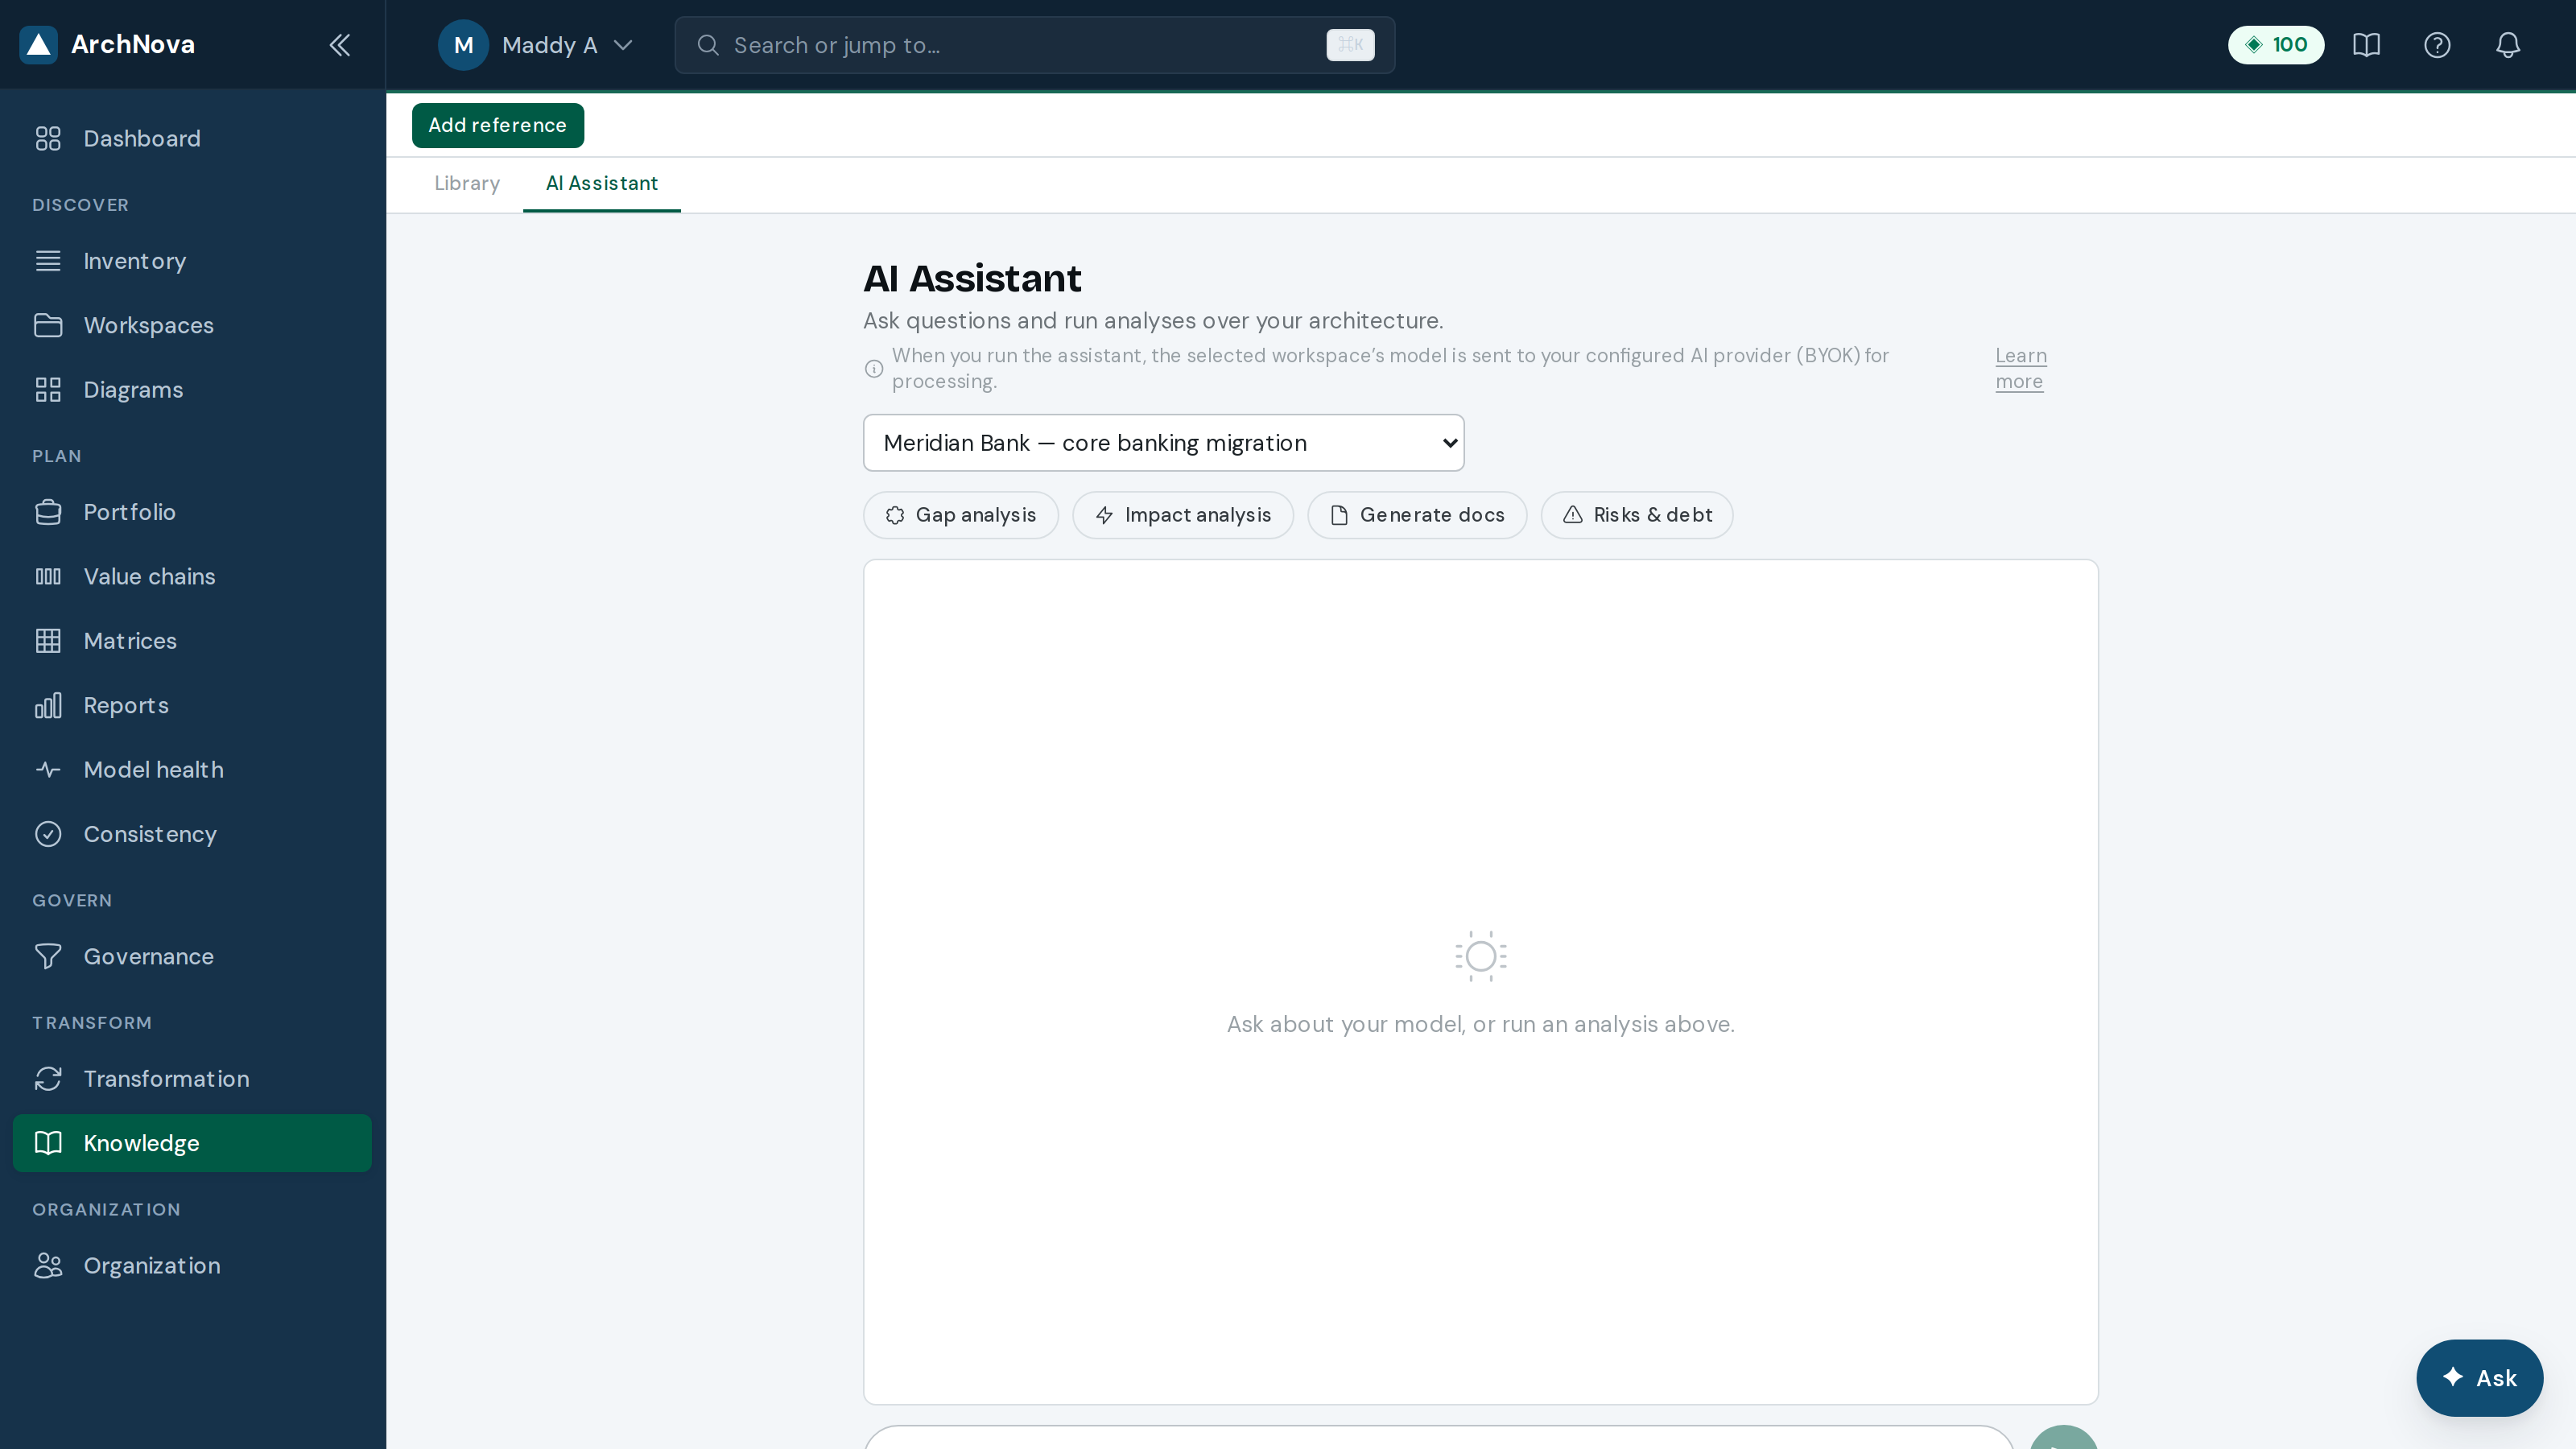
- Select the workspace to reason over — the assistant only sees the one you choose.
- Ask a question in the composer, or run one of the four analyses.
- Check the citations. An answer that names the elements it used can be verified; one that does not, cannot.
Who is involved
33Stakeholders
The stakeholder registry records who matters to each piece of work and what their role is, using RACI.
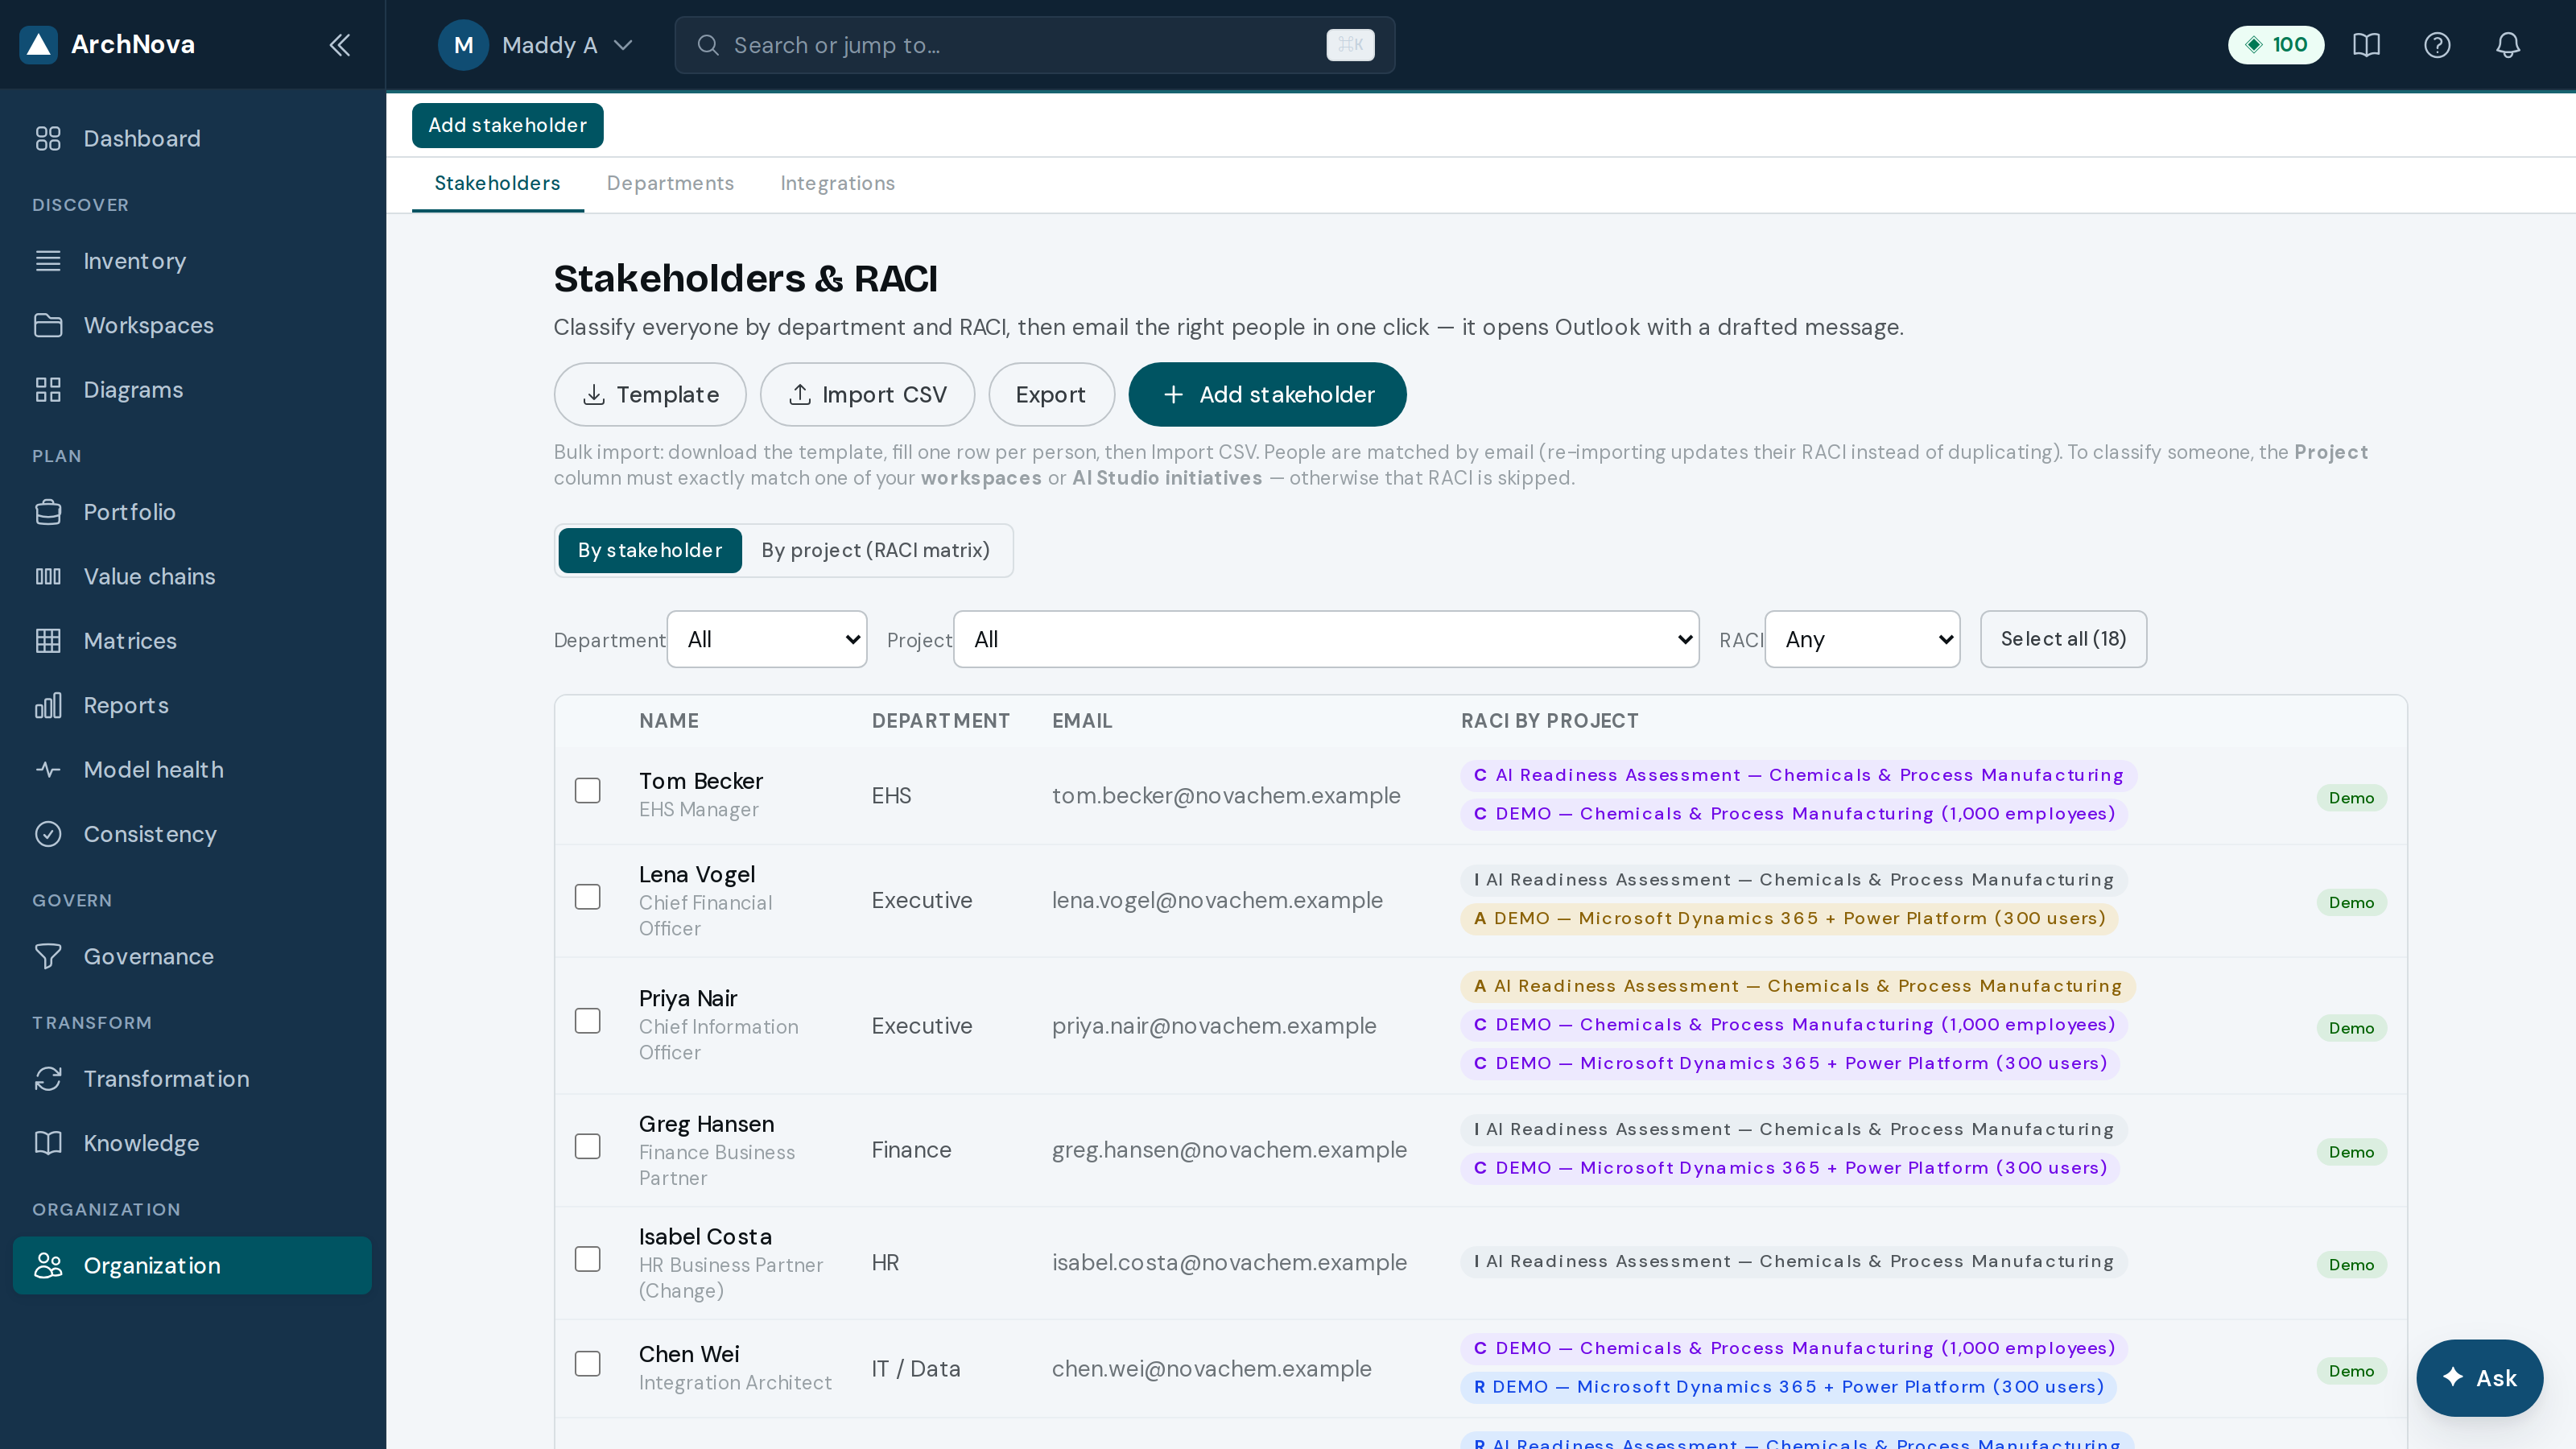
- Add stakeholder, or Import CSV to load a list you already keep.
- Assign RACI per project. One person can hold different roles on different projects — that is expected, not a mistake.
- Switch between by stakeholder and by project to see the same data from either direction.
- Select recipients and compose a situation-based email — kickoff, gate, action, status or risk — which opens in Outlook. Nothing is sent on your behalf.
34Departments
Departments roll the model up by owning team: what each one owns, what it costs them, and who to talk to.
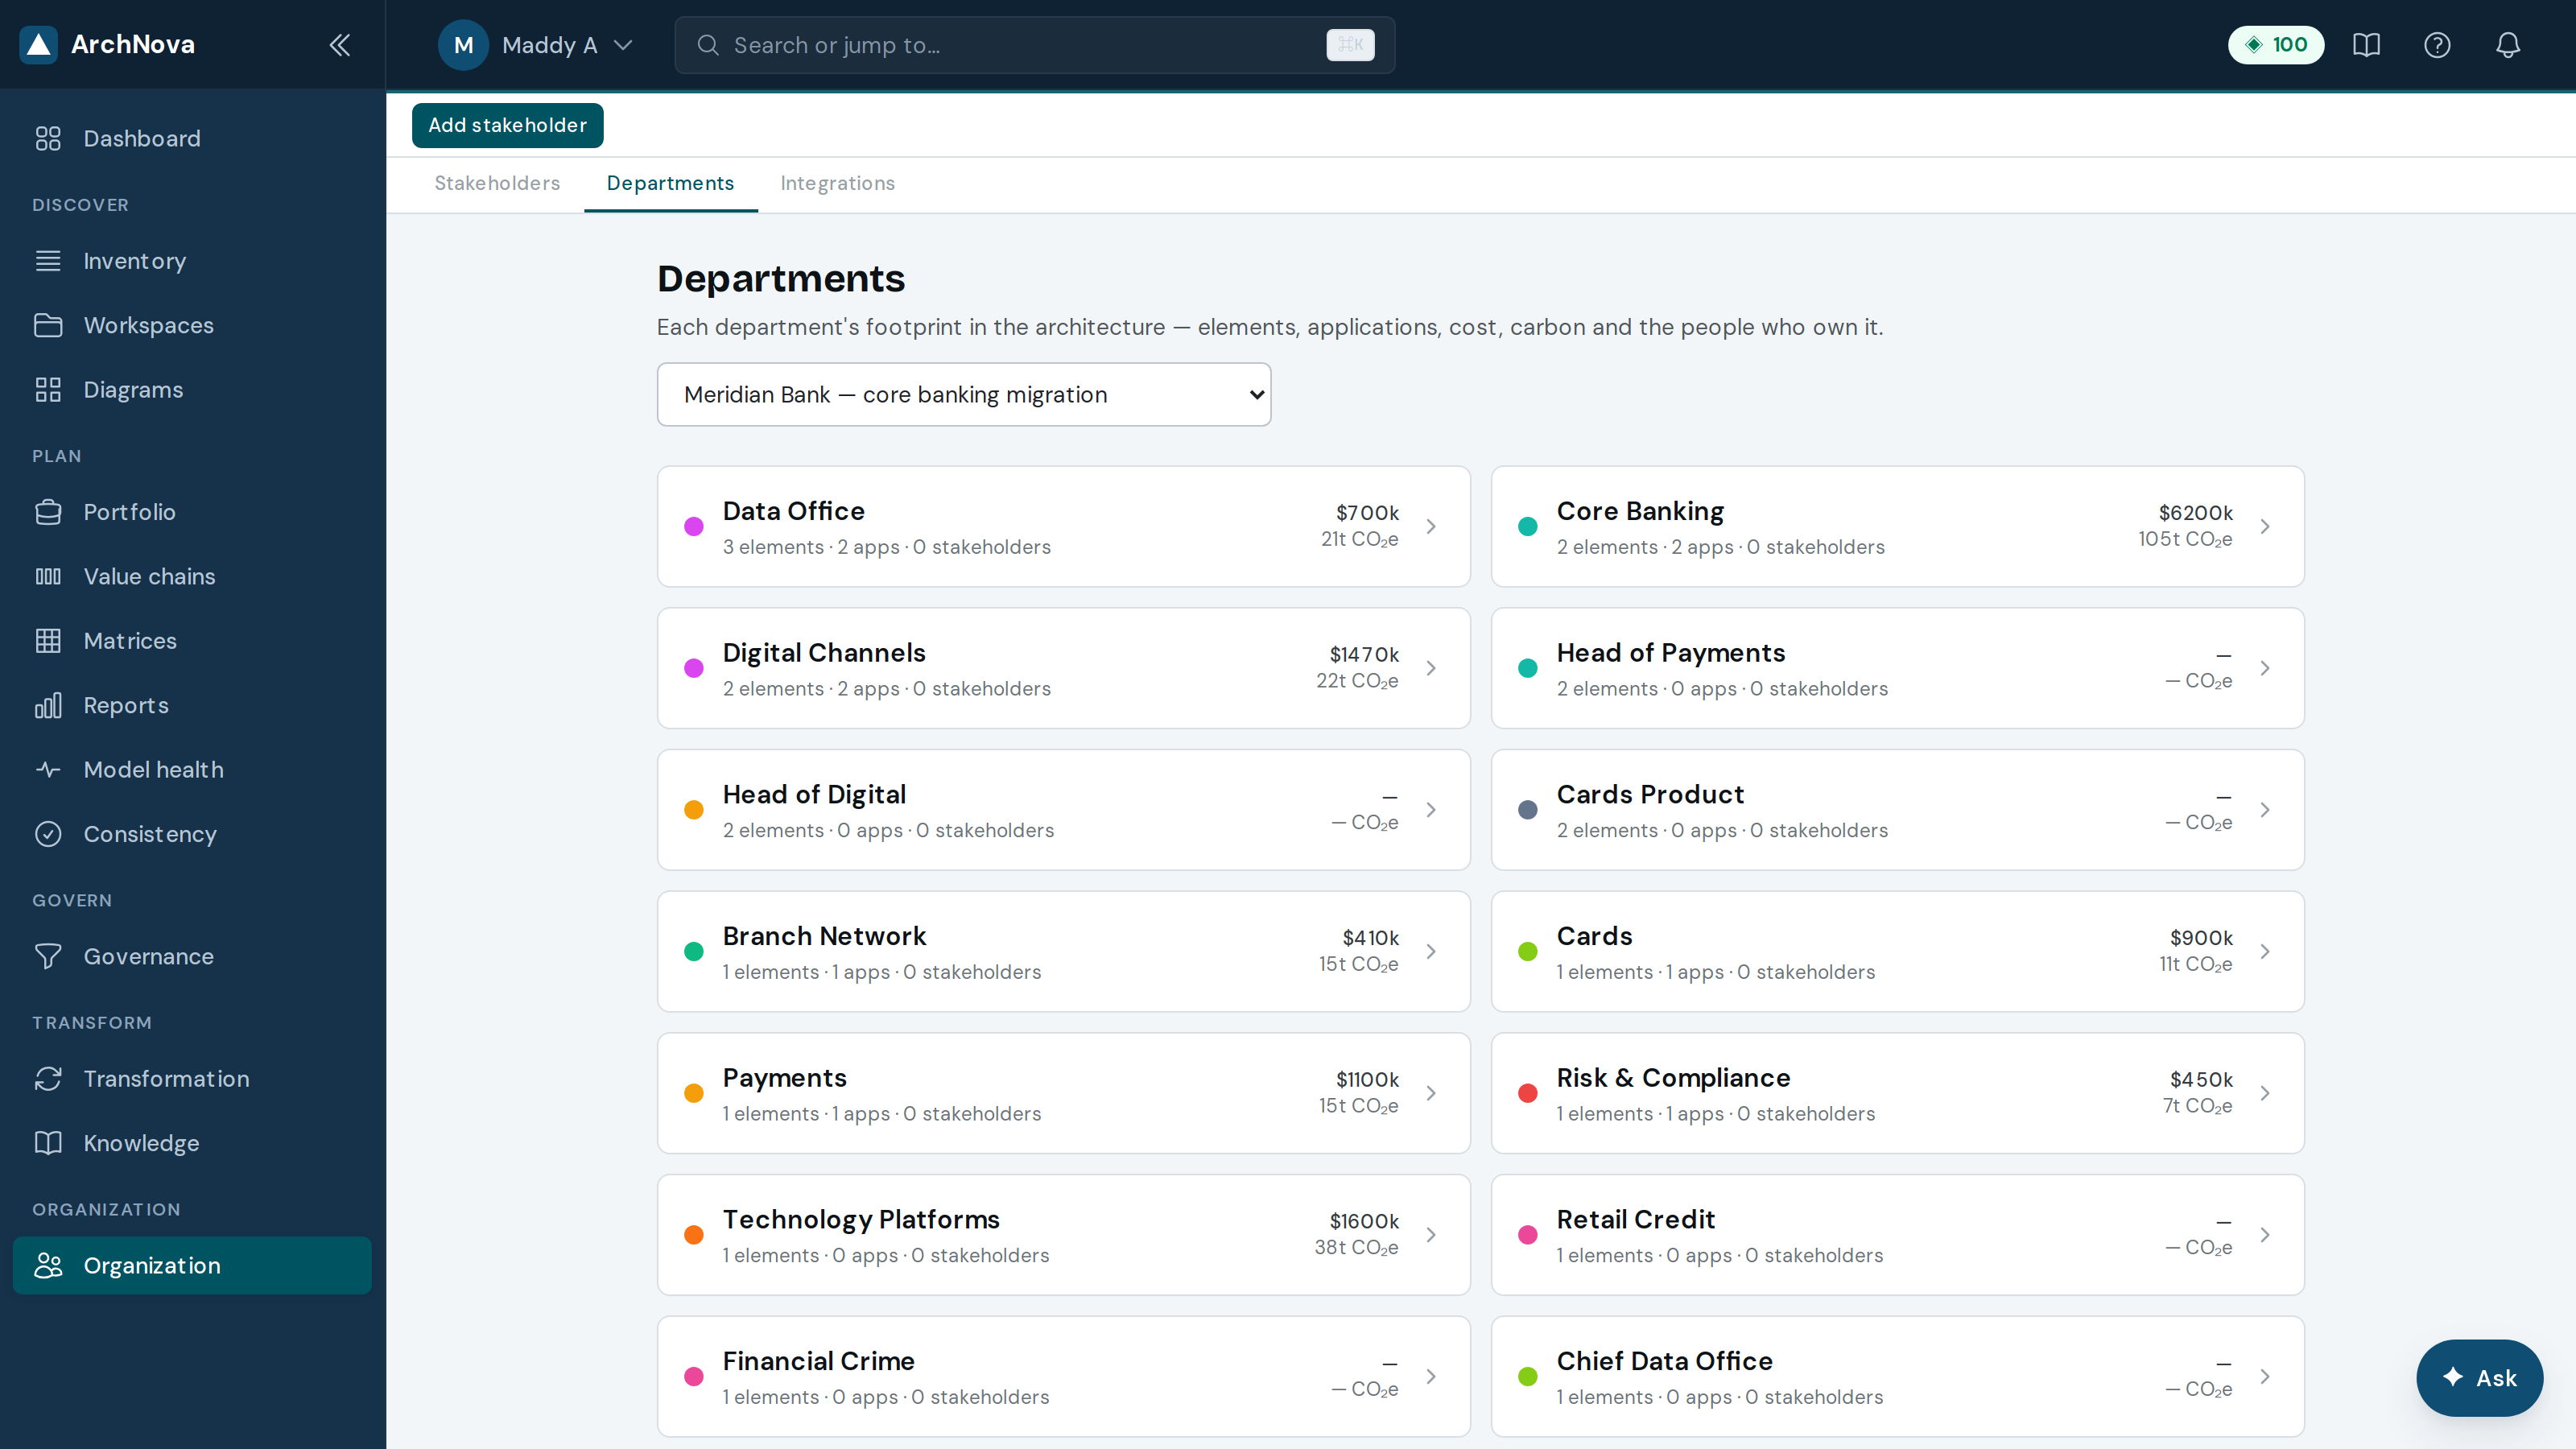
- Choose the workspace; departments come from the department attribute on each element.
- Open a department to see its elements, cost and carbon, and export the breakdown as CSV.
- Email this department drafts a message to the stakeholders registered against it.
35Integrations
Integrations bring architecture data in from the tools you already use, and push events out to the systems that need to know about changes.
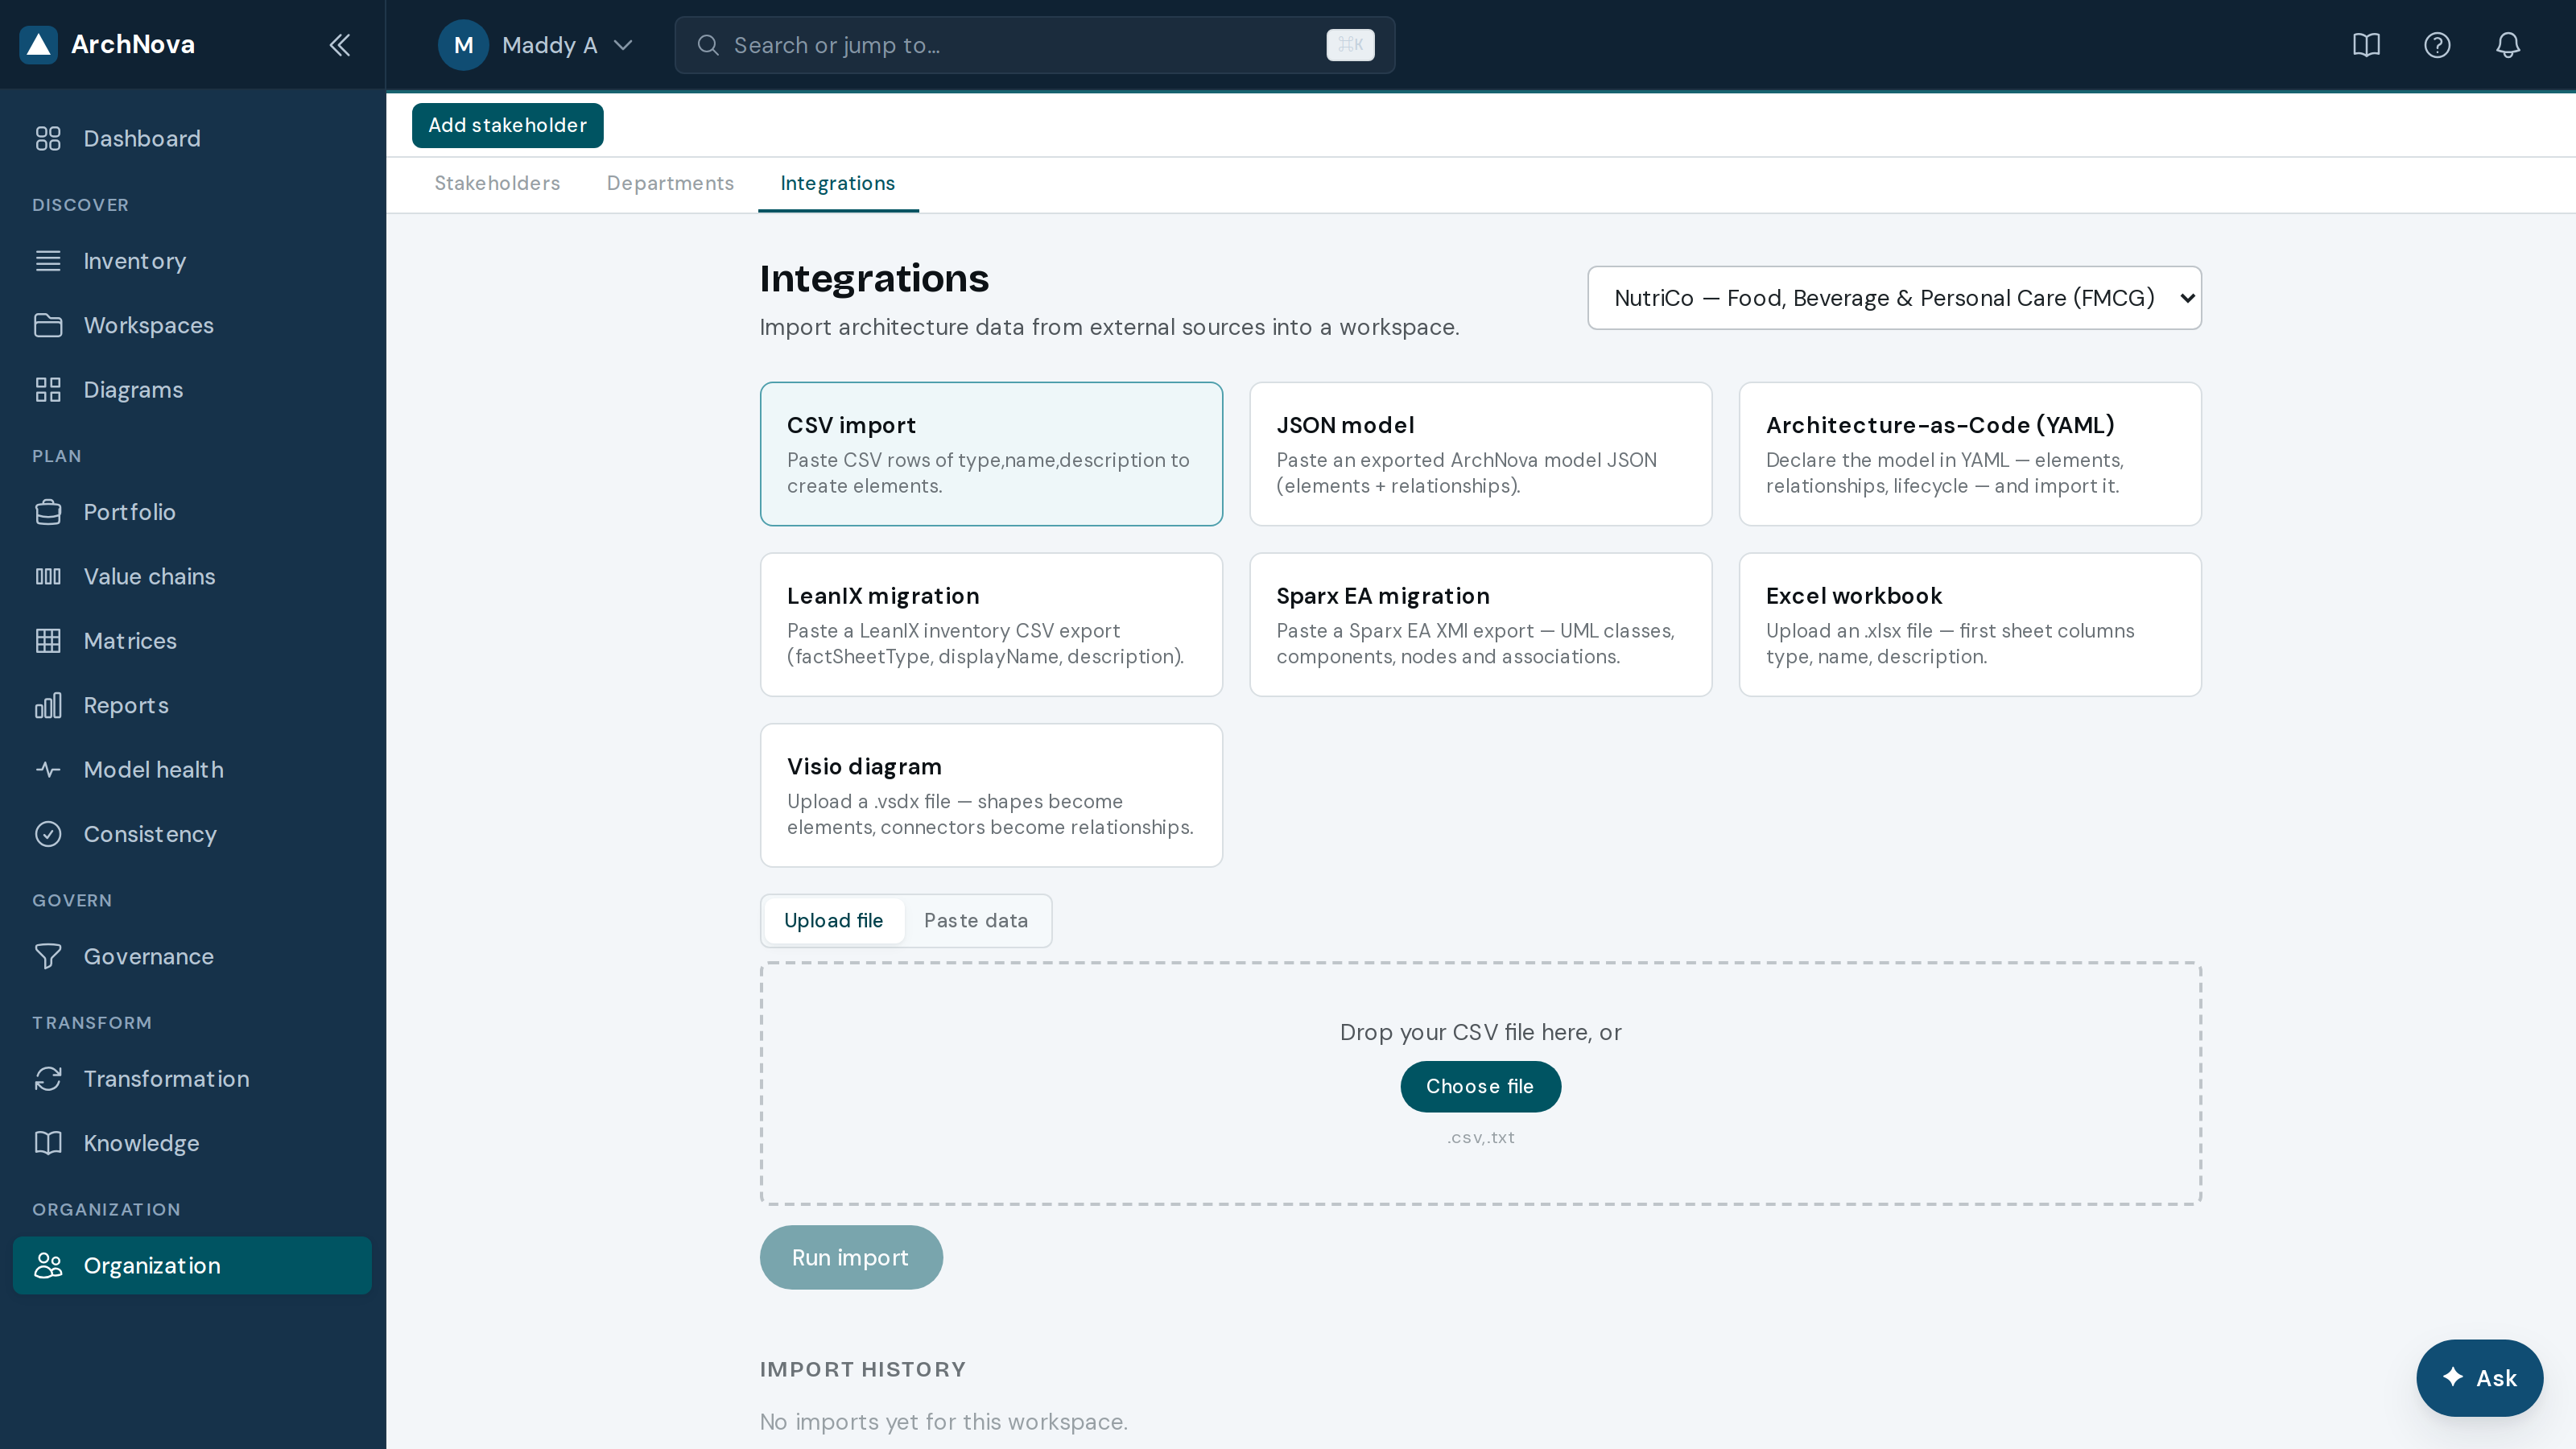
- Pick the source format and map its columns to Yantrio’s types.
- Import into a chosen workspace, then run Consistency to catch what did not map cleanly.
- Configure webhooks to POST signed events when elements or relationships change.
Making it yours
36Templates & packs
Templates and industry packs give you a populated starting model instead of a blank canvas.
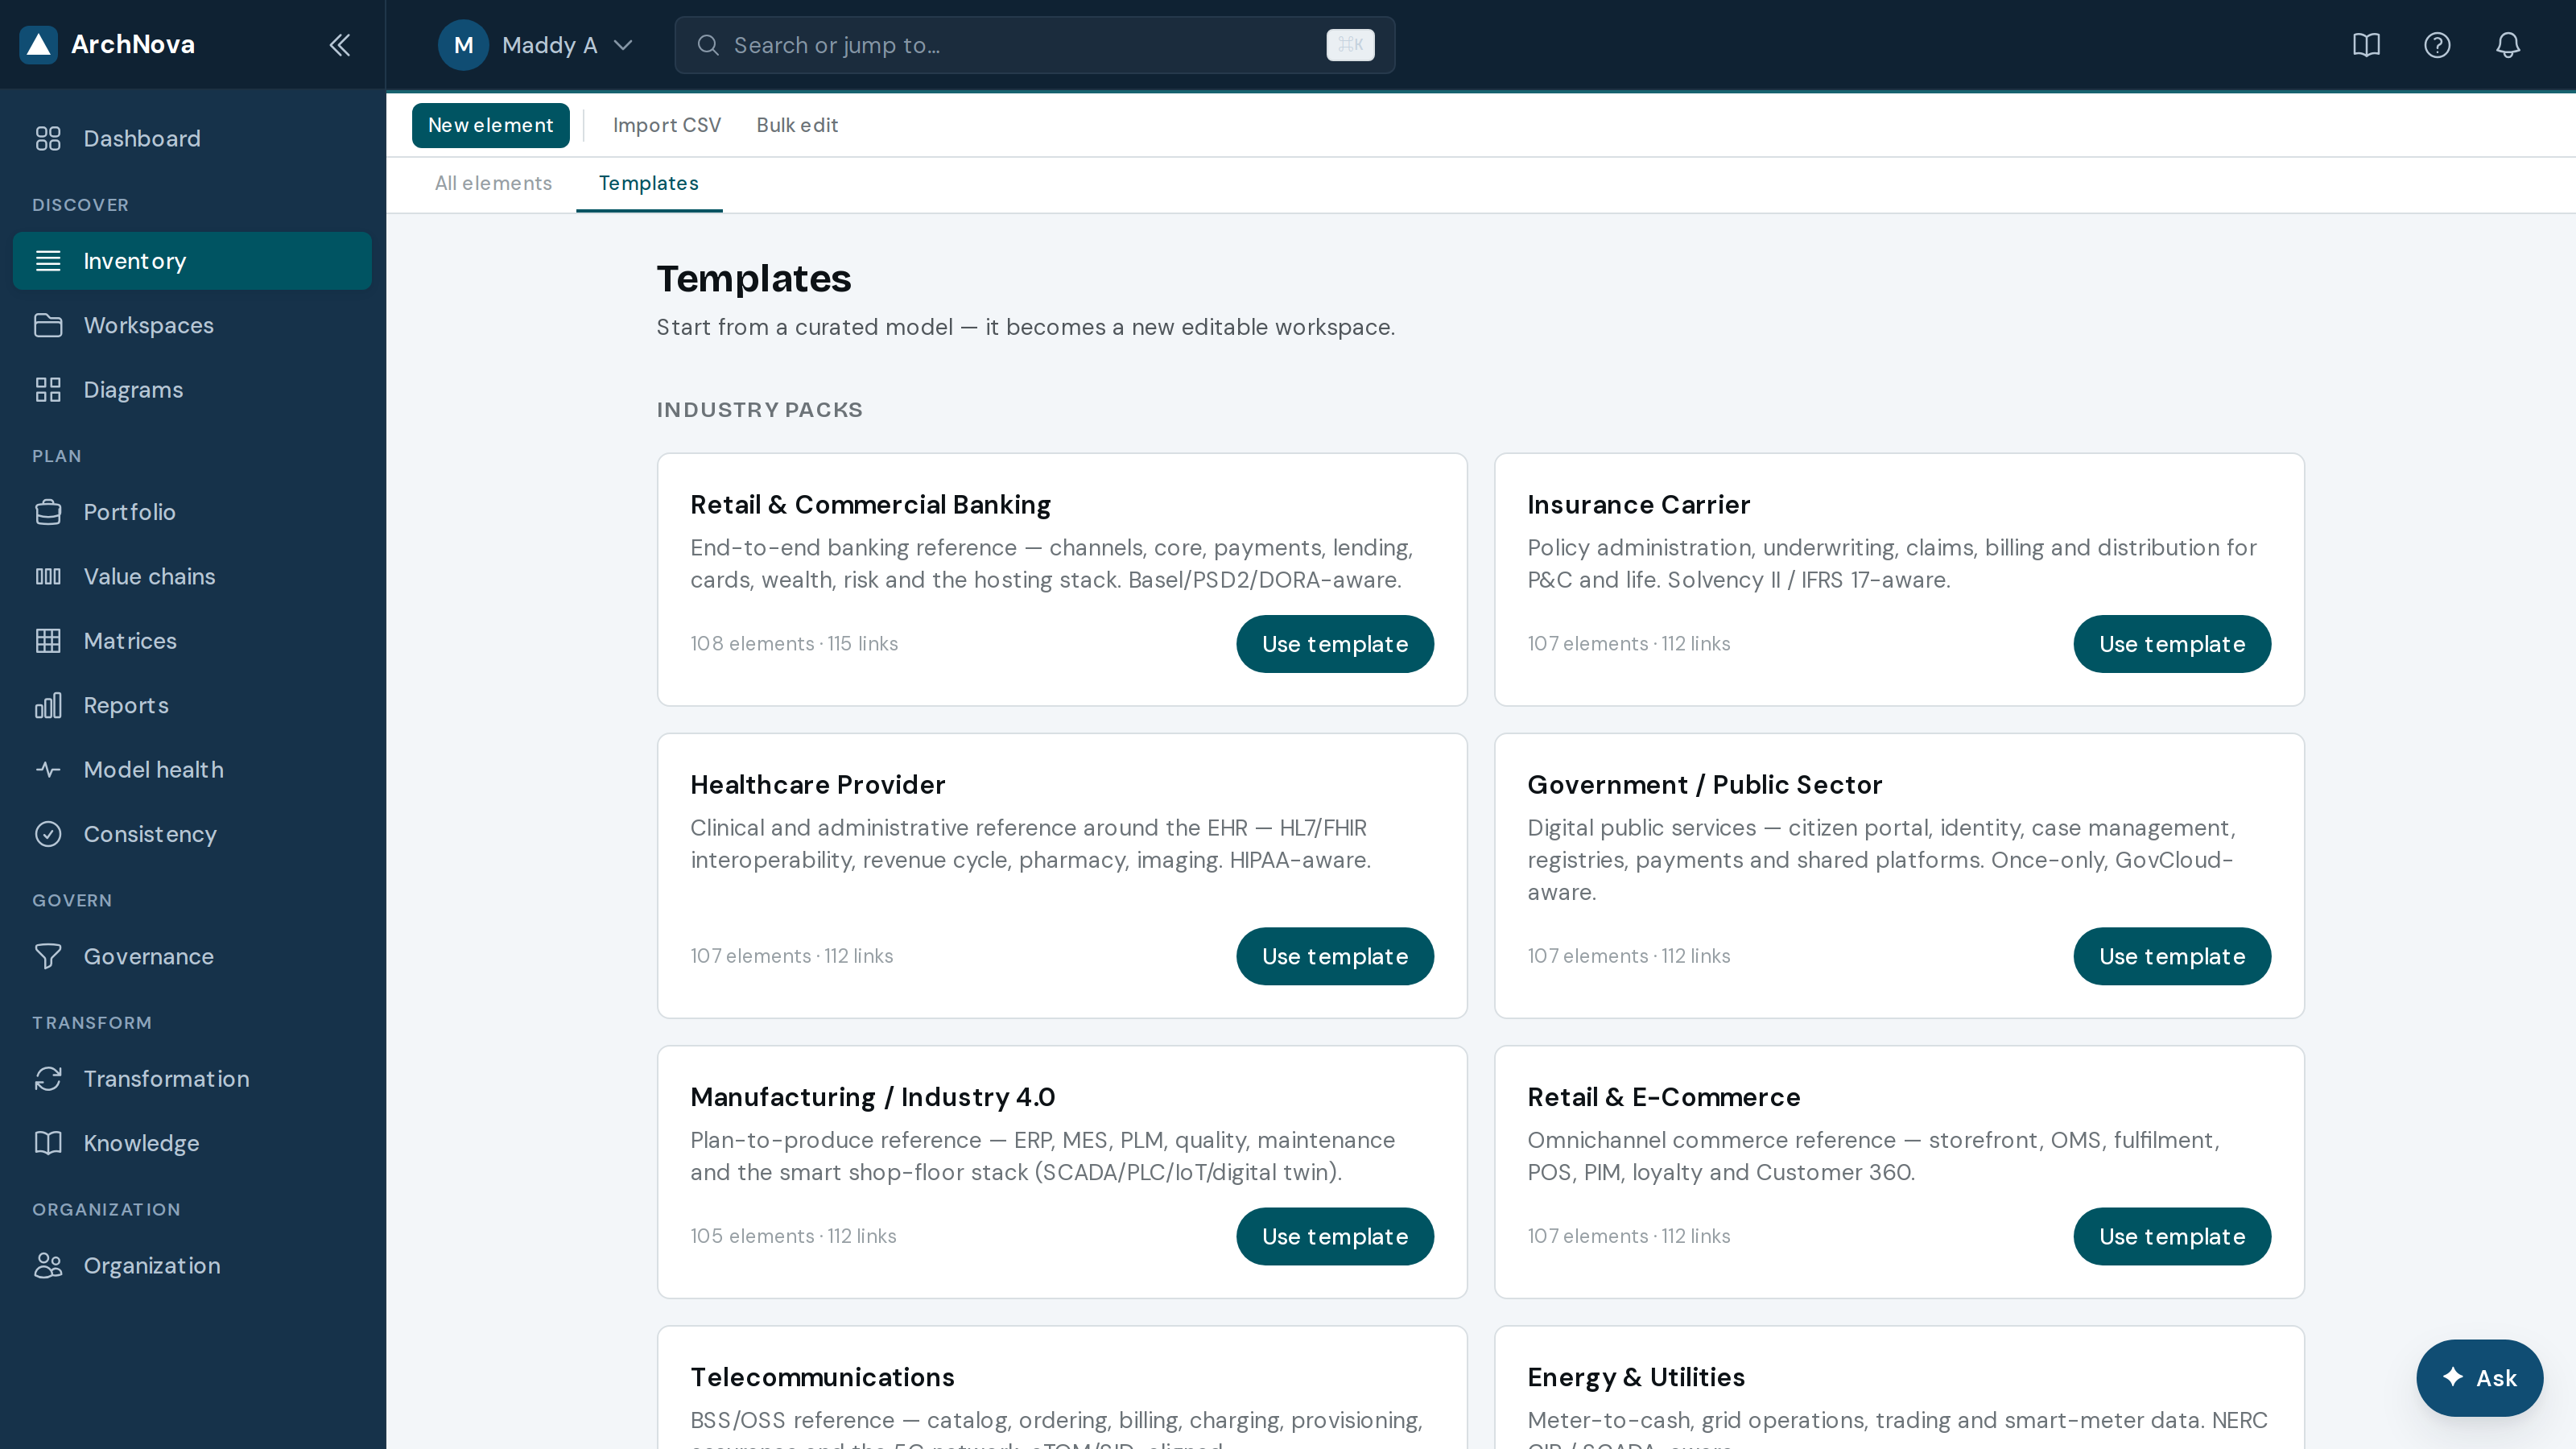
- Pick the pack closest to your sector and select Use template.
- It creates a workspace with capabilities, processes and typical applications already in place.
- Rename and delete until it describes your organisation. A pack is a scaffold, not an answer.
37Formatting
PowerPoint-style control over how anything looks — font, size, weight, colour, fill, border, background — on the canvas and on every diagram.
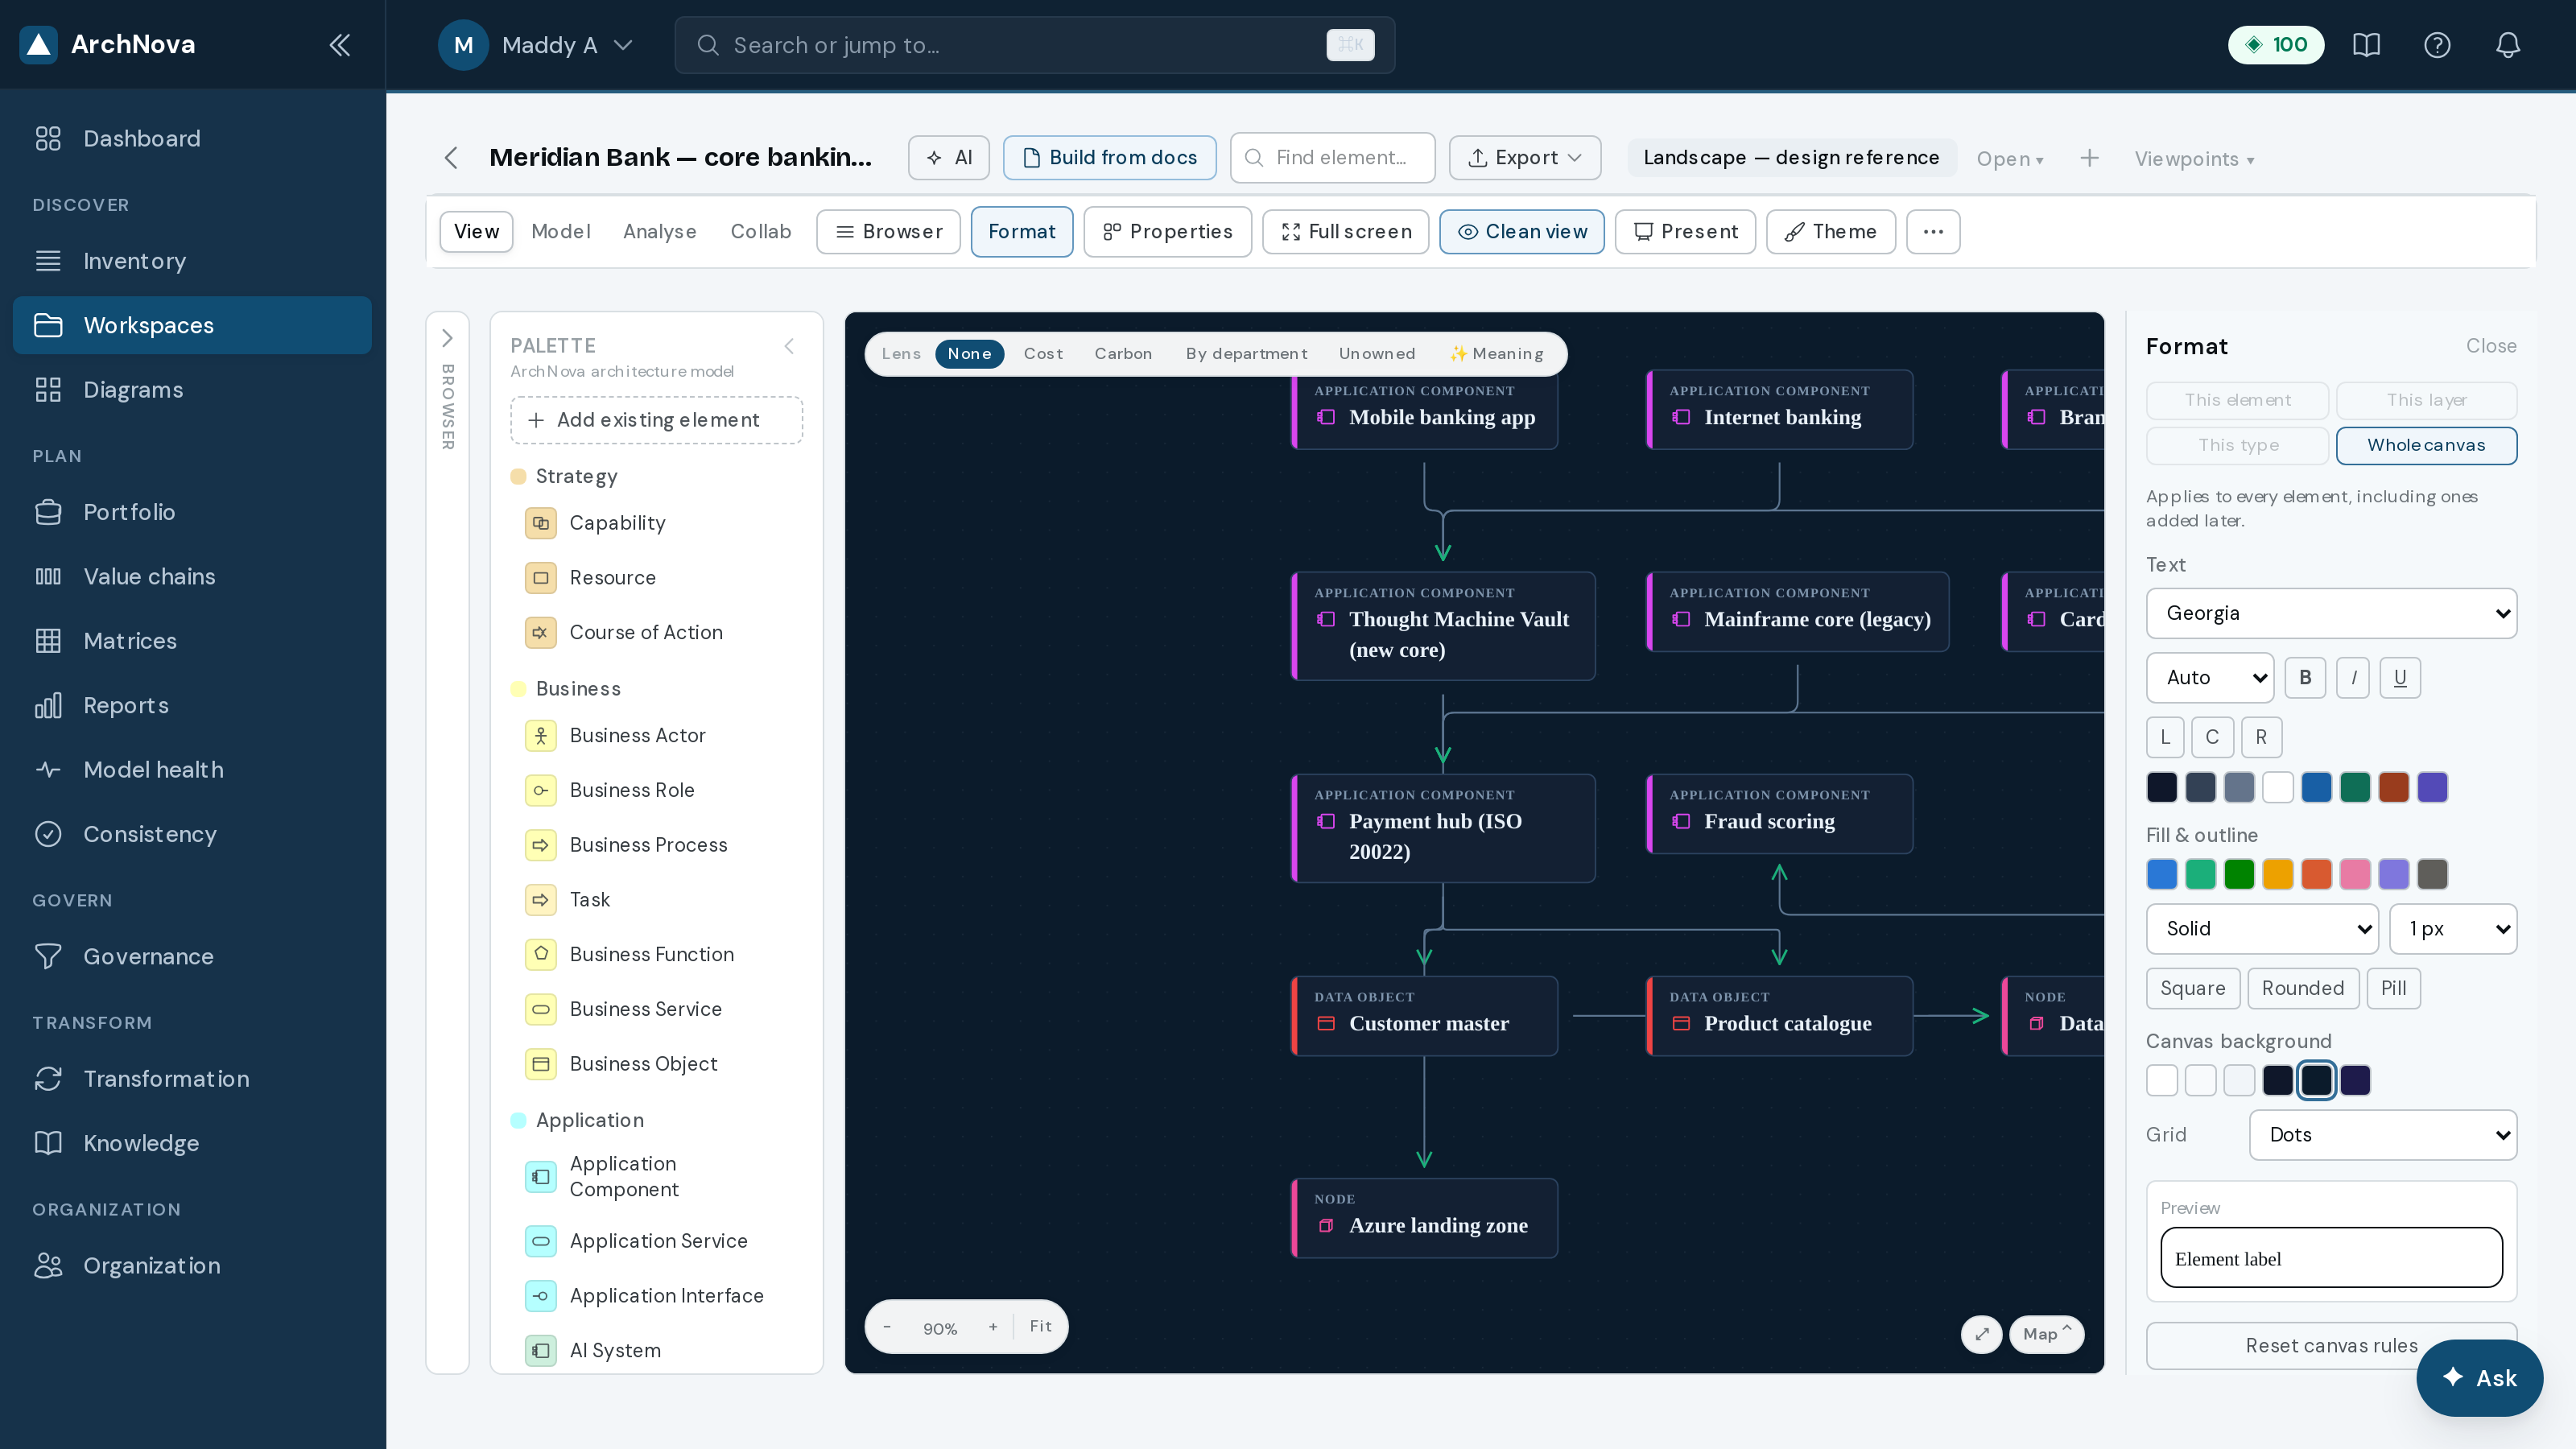
Choose what you are formatting
| Scope | Applies to |
|---|---|
| This element | Just the selected shape. |
| All in this layer | Every element in the layer — now and any added later. |
| All of this type | Every element of the type, e.g. all application components. |
| Whole canvas | Everything, plus the background colour and grid. |
Broad rules are stored on the workspace, so “all application components are navy” keeps applying to systems added tomorrow. A style set on one element always beats a broader rule, and a theme only supplies defaults — picking one never wipes a colour you chose deliberately.
38Settings
Settings covers branding, which modules appear in your sidebar, and workspace defaults.
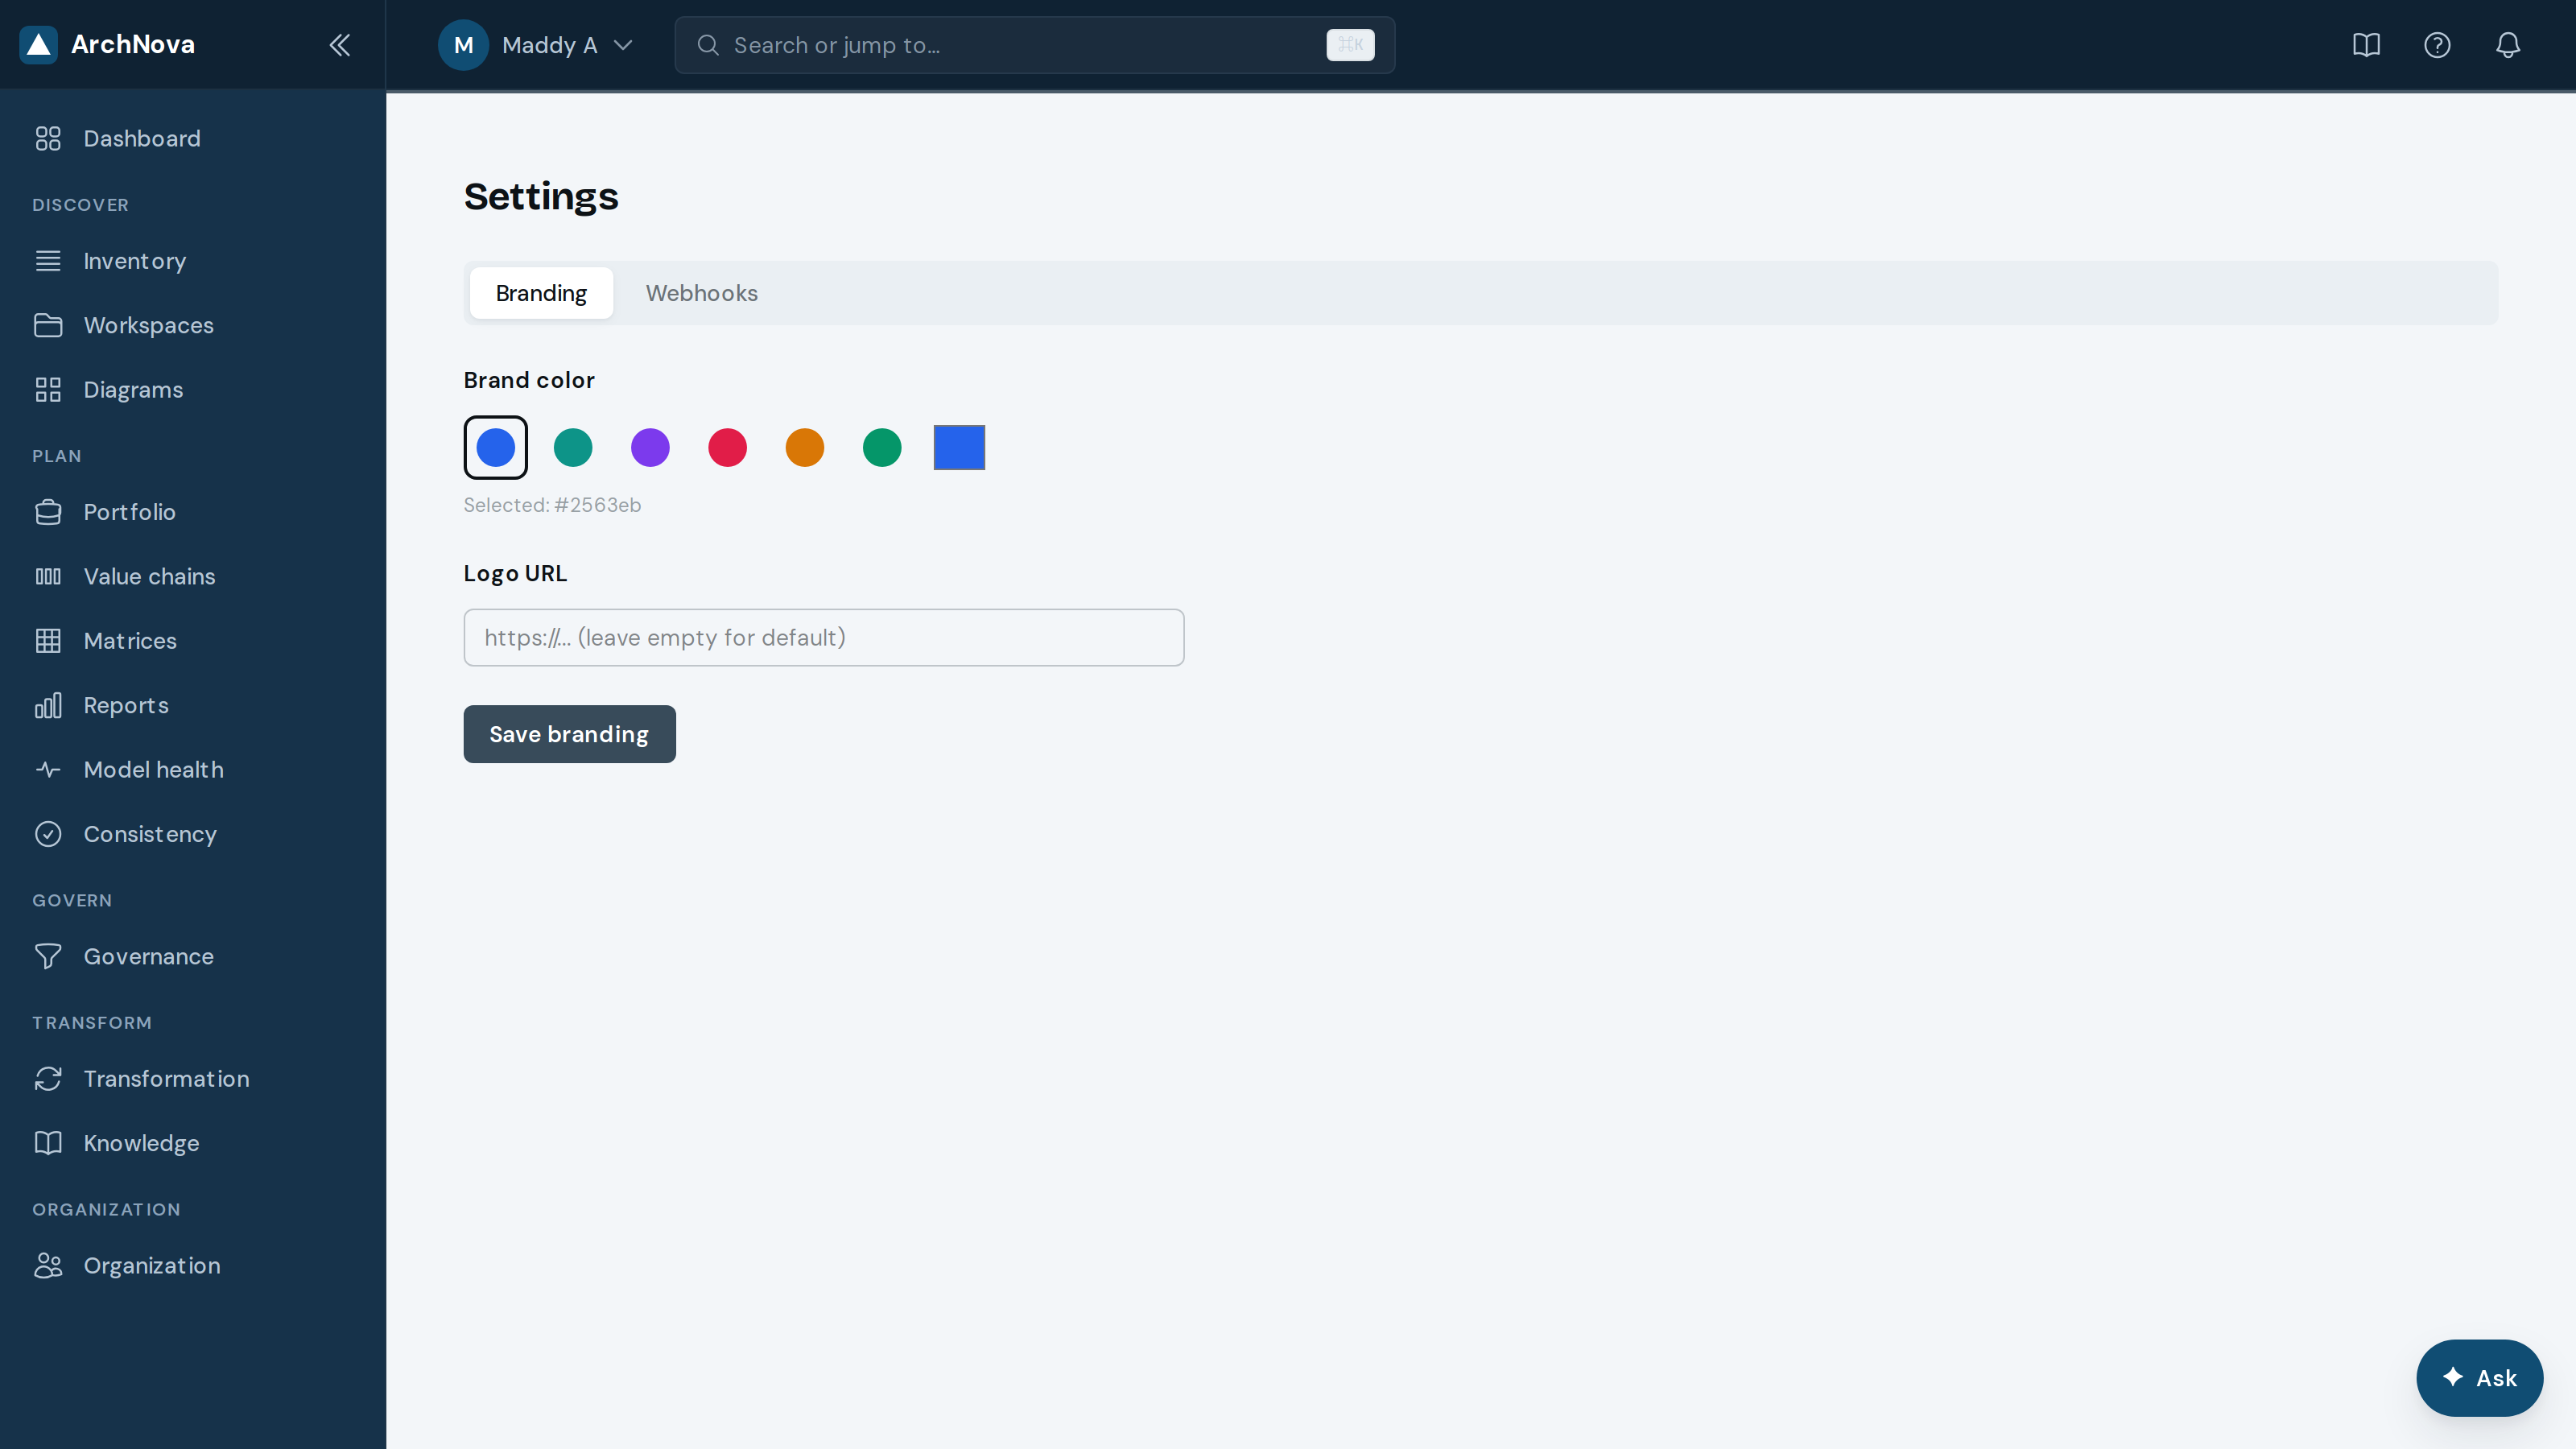
- Branding: set the accent colour and logo used in the app and on exports.
- Modules: hide what you do not use. Admins set the org-wide default; each person can then tailor their own.
- Webhooks: outbound event subscriptions, alongside the ones on Integrations.
39Your AI key
Every AI feature runs on your own provider key. You add it once, and it powers build-from-docs, the lenses, the assistant, blueprints and every analysis.
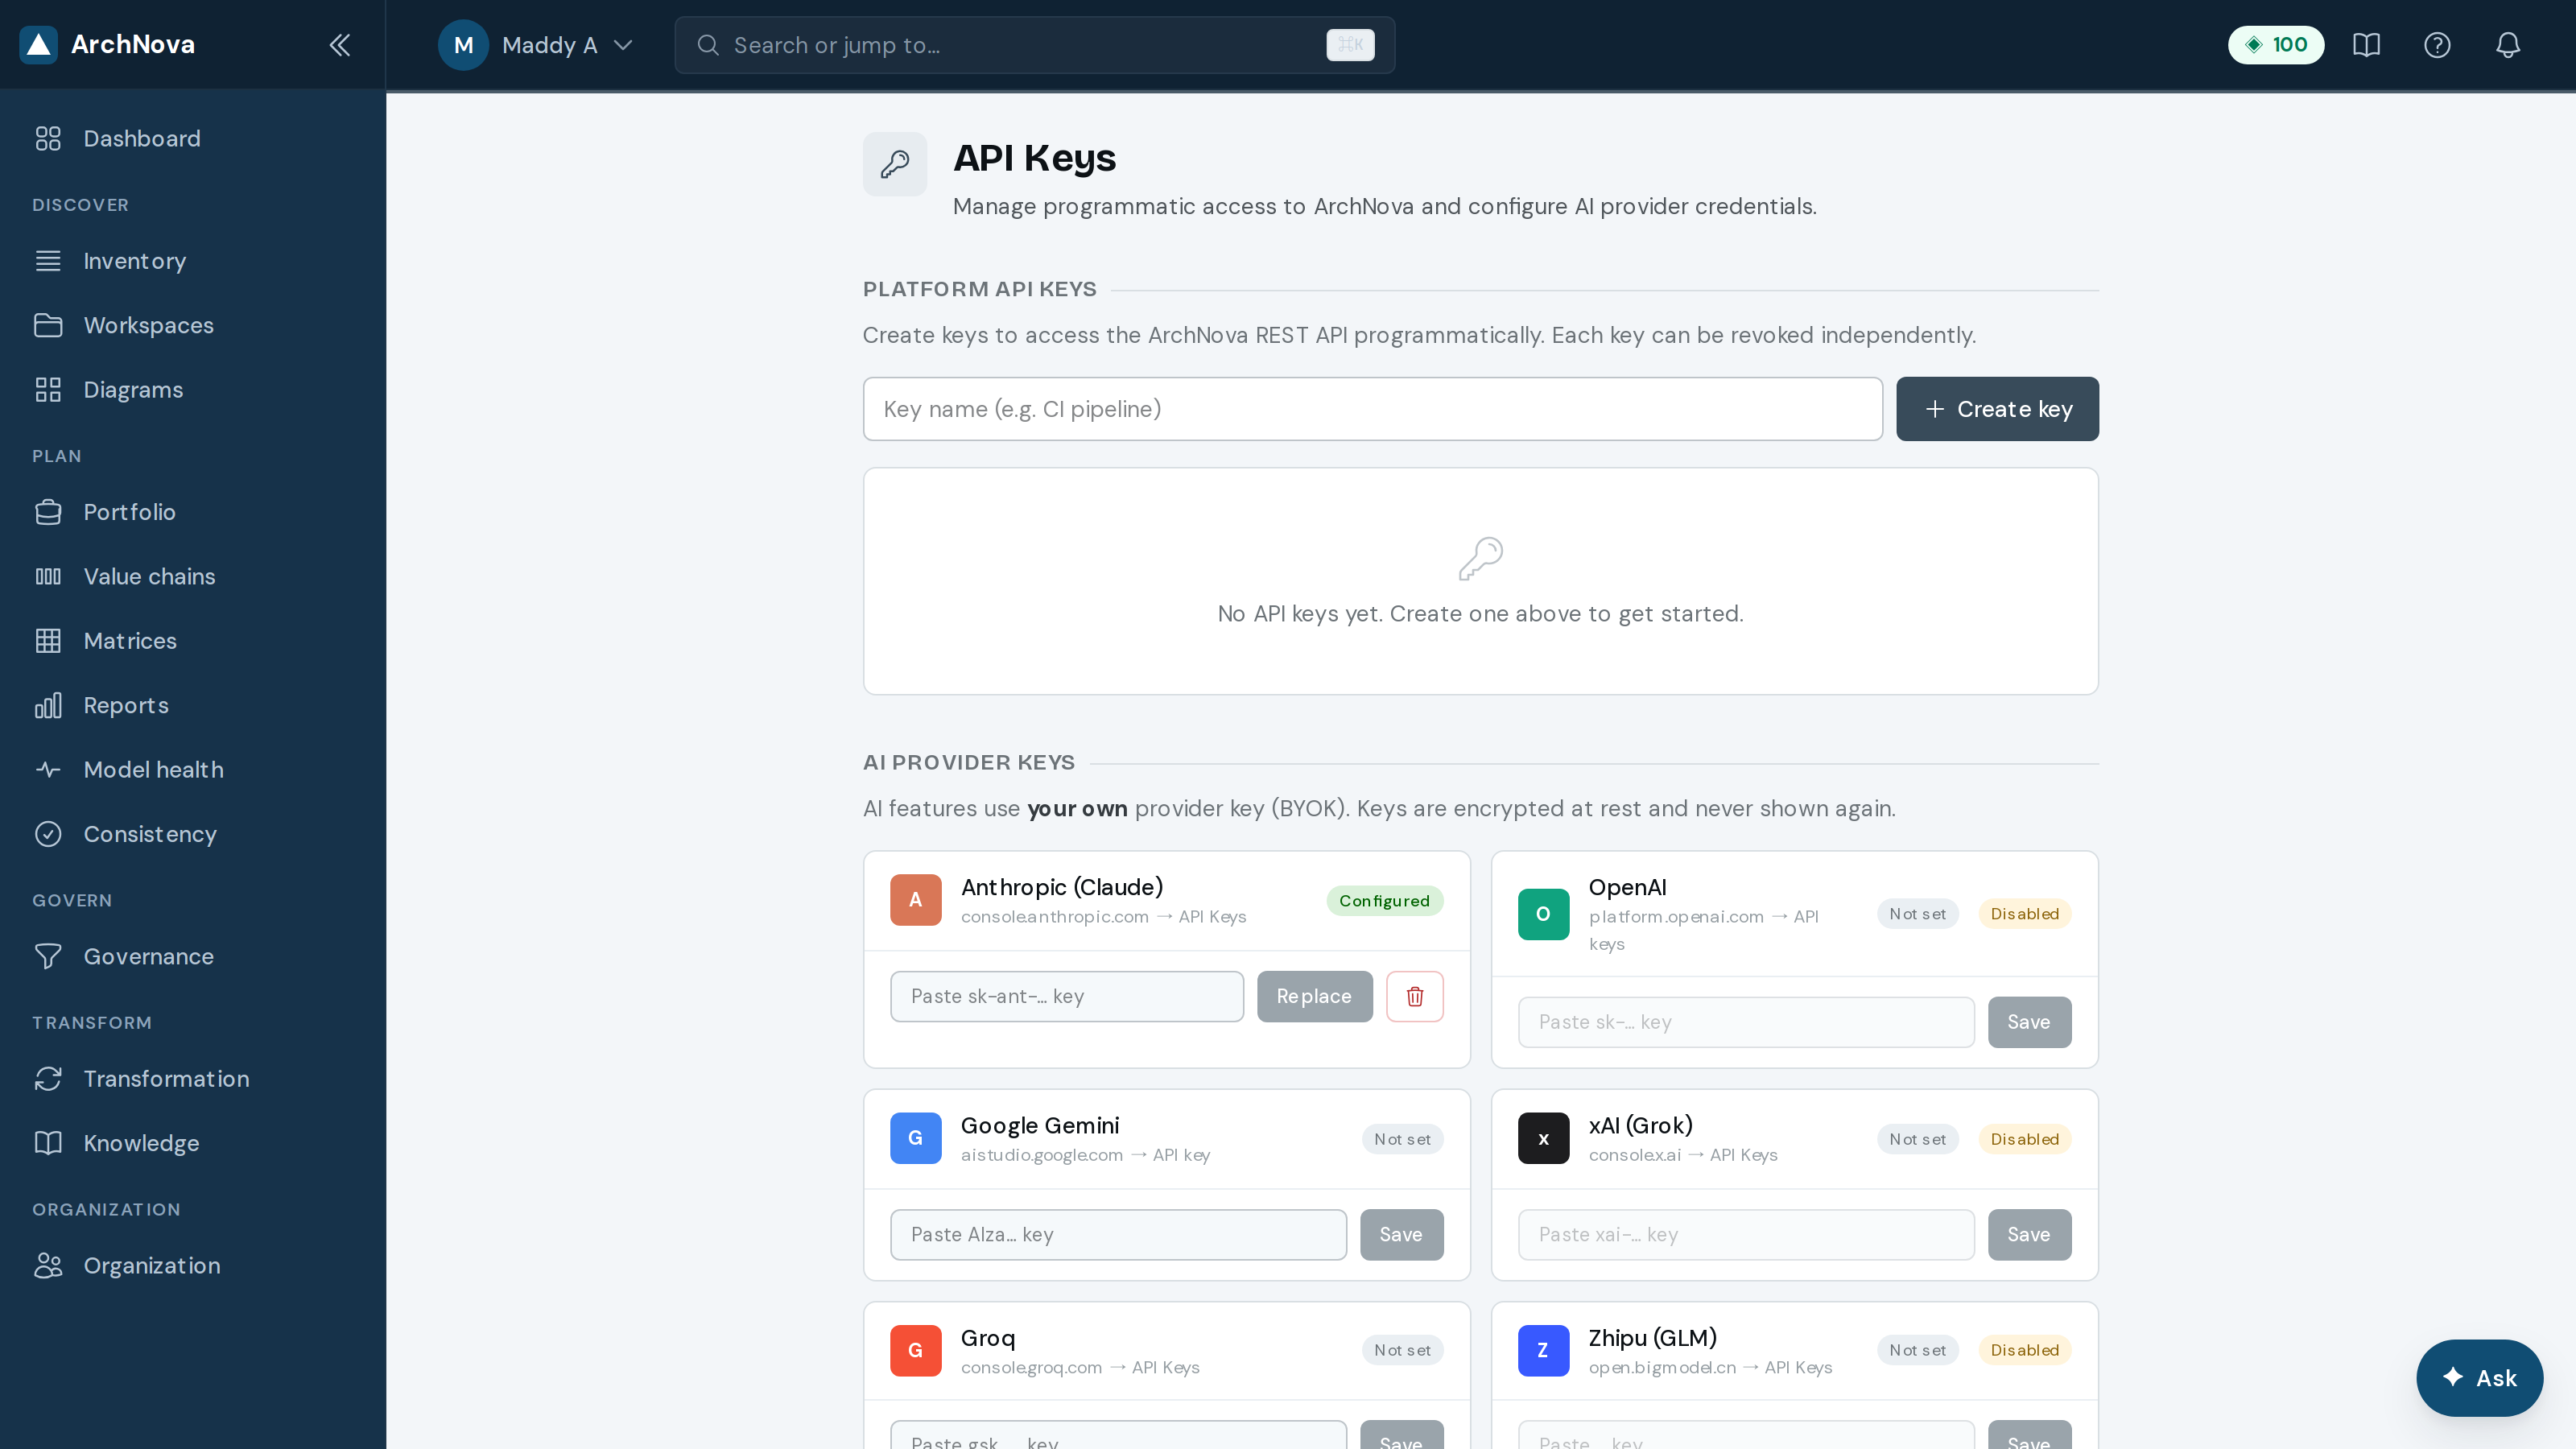
- Open My Account → API Keys.
- Paste your provider key into its slot and save. The slot shows Configured once accepted.
- Keys are stored encrypted and never shown again after saving — keep your own copy.
- Platform API keys are separate: those let your own systems read Yantrio through its REST API.
40Help
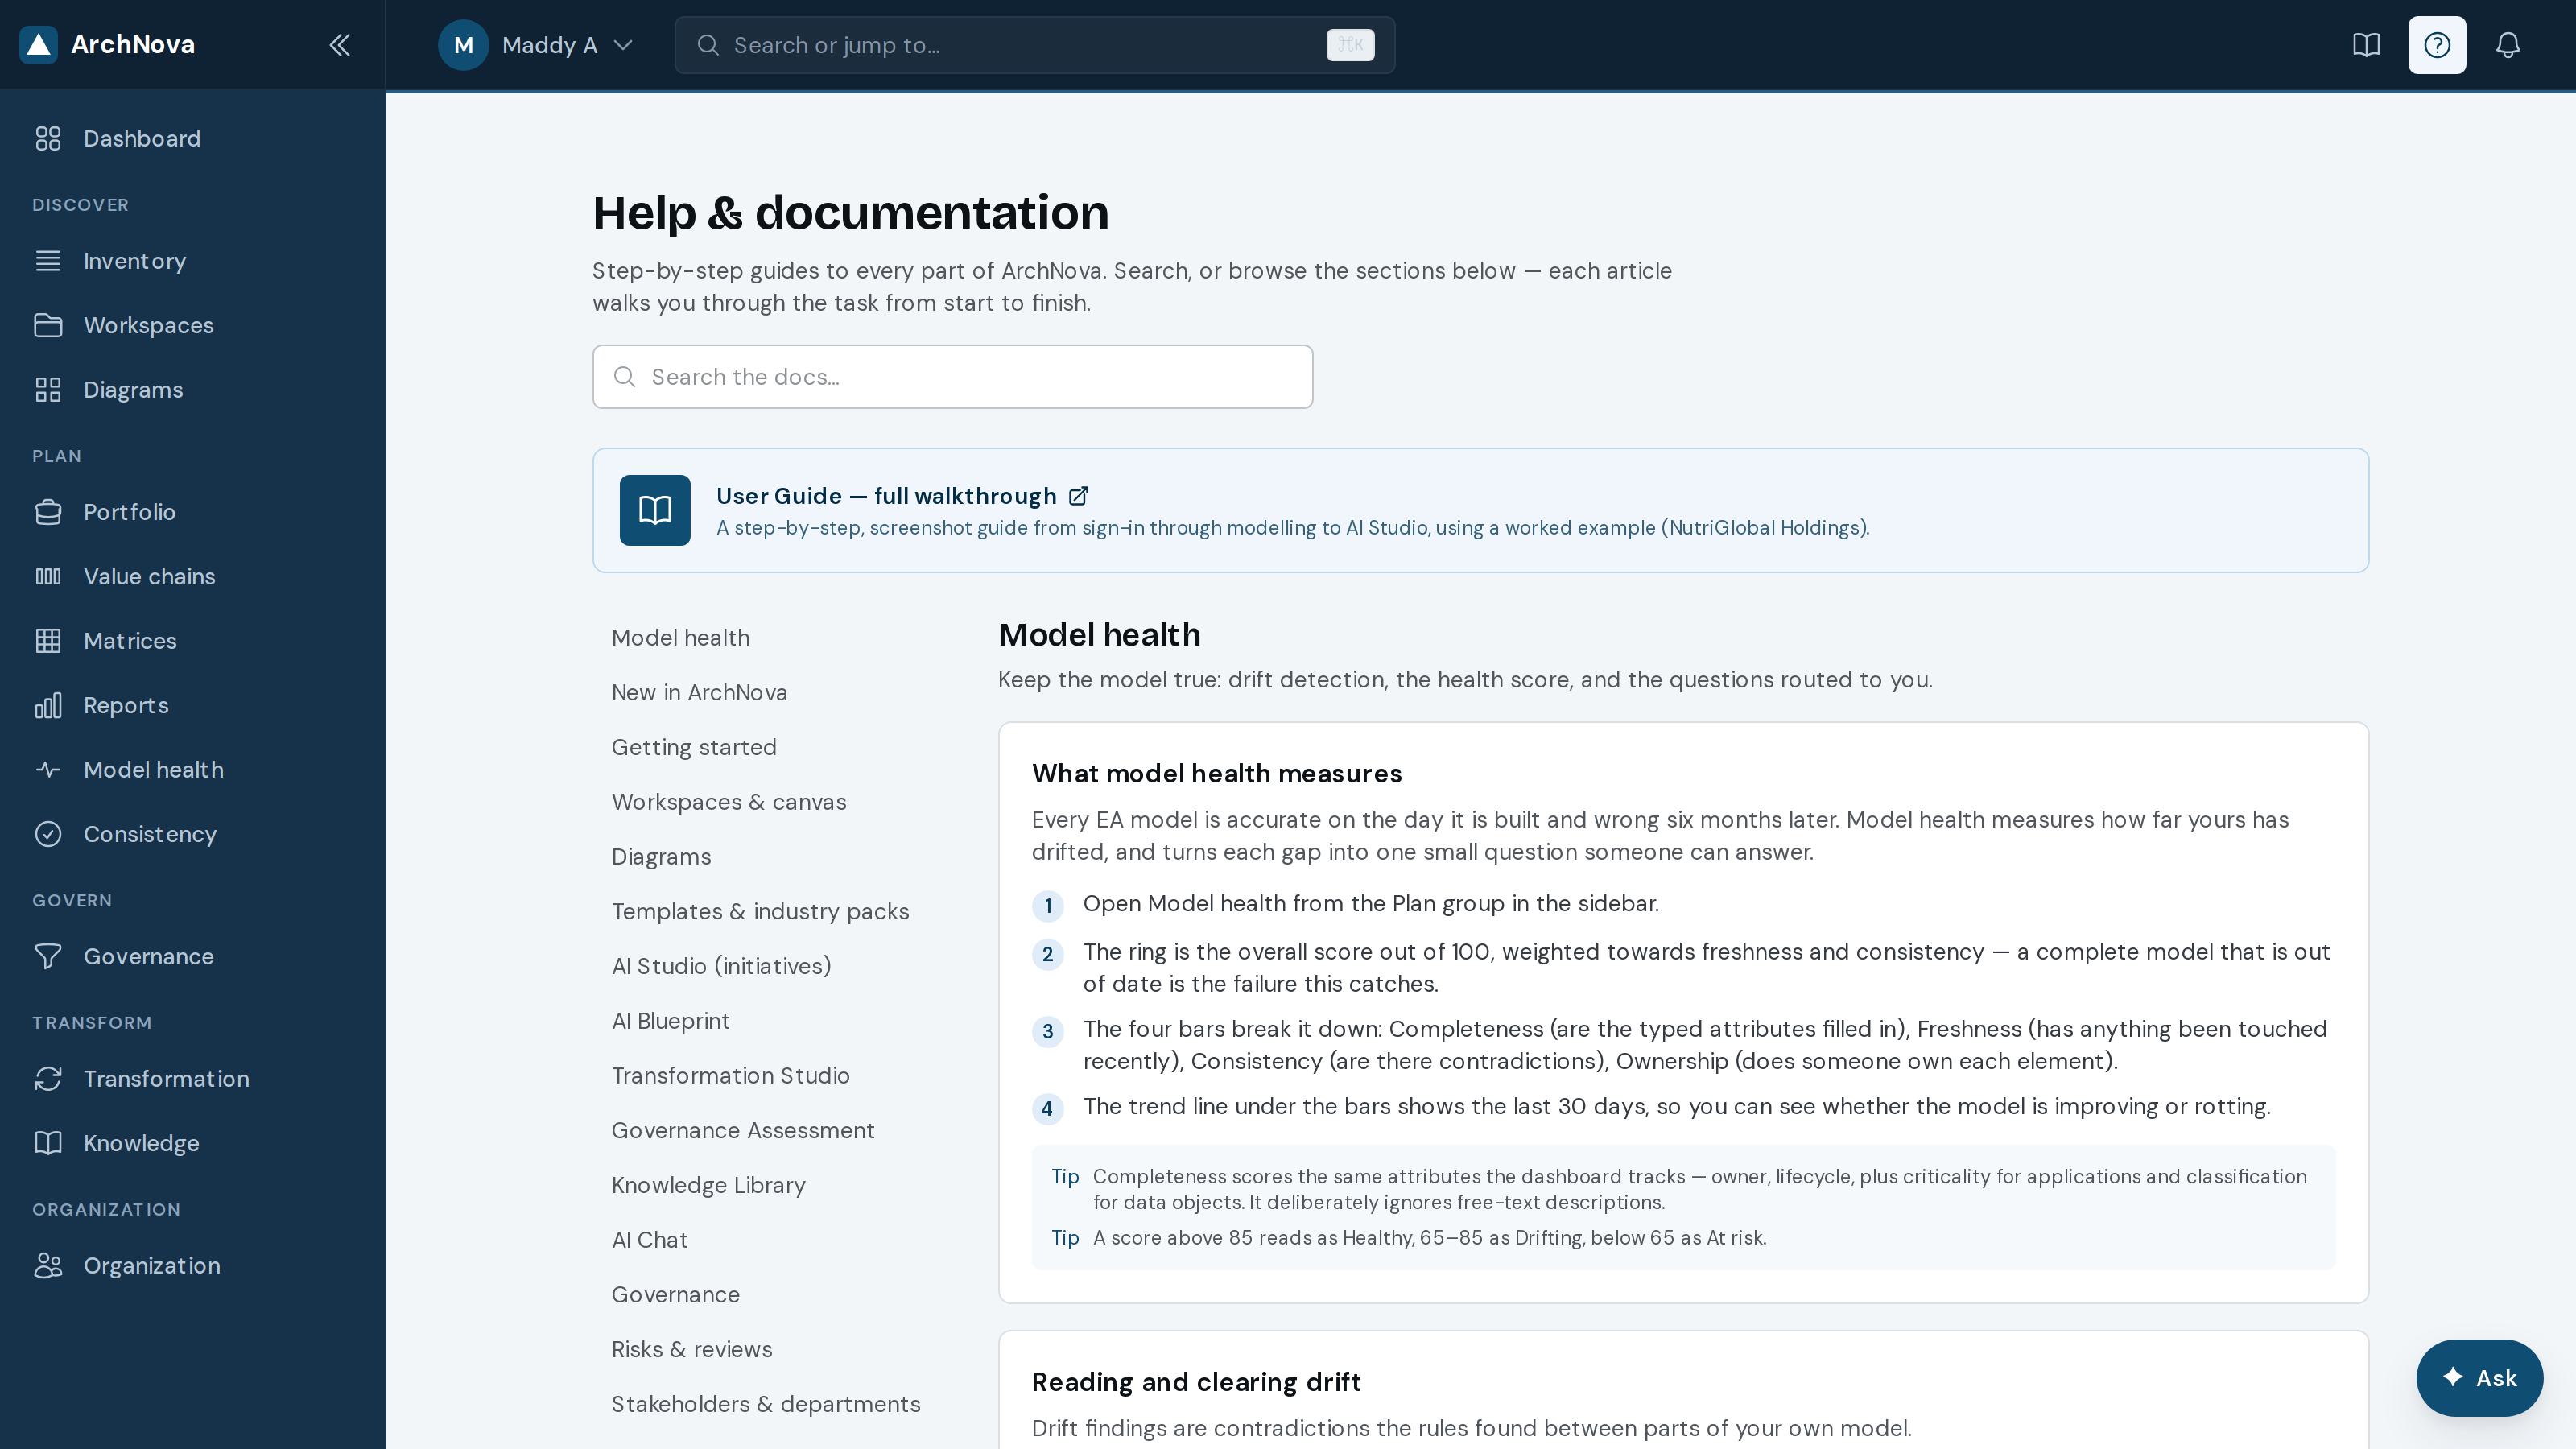
The in-app help centre carries a short article per feature, searchable, with the accuracy checklists for AI features repeated where you need them.
·Tips & shortcuts
| Shortcut | What it does |
|---|---|
| ⌘K / CtrlK | Command palette — jump to any module, element or action. |
| Esc | Clears the active canvas lens. |
| Find element… | Jump straight to an element by name on a large canvas. |
| Full screen | Hides the app chrome — the right way to present or screenshot a landscape. |
| Fit | Frames the whole model. Press it twice after a layout change. |
Habits that make the platform work
- Fill attributes early. Owner, lifecycle and criticality unlock the portfolio, the lenses and the assistant all at once.
- Keep one estate per workspace. Mixing unrelated systems degrades every analysis that follows.
- Run Consistency before you publish. It is deterministic and takes seconds.
- Read AI citations. Grounded answers name their elements; treat anything unsourced as a prompt to check, not a fact.
- Model what you will act on. A smaller model that is current beats an exhaustive one that is stale.